









Risk, in the world of equity portfolio management, is rarely a simple concept.
The origin of the word is a topic of some debate. Its most plausible etymological route traces back to the medieval Latin ‘resecare’ – literally, ‘to cut’ – which passed into the merchant nautical language of the Mediterranean as ‘risicum’. In the seafaring commerce of that era, the expression described a specific and deliberate behaviour: the practice of sailing closer to the shoreline to save time, shaving distance at the cost of exposing the vessel – and its cargo – to reefs, rocks, and shallow water.
A captain with a habit of cutting corners was, by definition, considered risky by those with capital at stake, who bore the financial consequences of his decisions; and it is from this association between cutting a shorter course and courting ruin that the modern concept of financial risk was born.
That the vocabulary of risk emerged from maritime trade is no accident. The original risk-bearers were merchants and underwriters pricing the possibility that a ship, and everything it carried, might simply not come back. The language they reached for – of uncertain seas, of things irretrievably lost, of deliberate choices made in full knowledge of what could be left behind – has never entirely left us. What has changed, over centuries of financial evolution, is not the essence of the problem but the sophistication of the instruments we use to measure and manage it.
From absolute to relative risk
Many intellectual traditions have shaped how finance thinks about risk today. Benjamin Graham – the father of value investing – defined it simply and stubbornly as the probability of permanent loss of capital. Volatility, in Graham’s framework, was noise: emotional discomfort, not financial damage. A business bought at a price well below its intrinsic value was, by definition, a low-risk investment, even if its share price gyrated violently in the interim.
Harry Markowitz, on the other hand, recast risk in purely statistical terms as the variance of returns around an expected value – and in doing so gave birth to modern portfolio theory, the efficient frontier, and the entire architecture of quantitative risk management that institutional investors use today.
The tension between these two traditions – one viewing risk as the permanent loss of capital, the other as short‑term volatility in relative returns – reflects two fundamentally different notions of risk that pull a portfolio manager in opposite directions.
For decades, one metric has served as a kind of north star for institutional investors judging whether a fund manager is ‘on risk’ or ‘off risk’ relative to their benchmark: tracking error.
At its core, tracking error measures how much a portfolio’s returns deviate from those of its benchmark over time, technically, the standard deviation of the difference between the two return series. A tracking error of zero means the portfolio mirrors the index perfectly; as active decisions diverge, through stock omission, sector tilts, or concentration differences, tracking error rises accordingly.
The metric has genuine virtues: it is simple, communicable, and easy to explain to trustees, risk committees, and clients. Its shortcomings, however, are significant. It measures relative risk rather than absolute risk, penalises positive deviations as harshly as negative ones, and – most critically – treats the benchmark as a neutral, risk-free reference point. When that assumption breaks down, as it does when the benchmark itself becomes concentrated, overvalued, and potentially fragile, the entire framework begins to produce dangerously misleading signals.
The benchmark has changed: Concentration at historic extremes
To understand why tracking error needs reassessing, one must first appreciate how radically the composition of major equity indices has shifted. Over the past two decades, equity markets have become dramatically more concentrated , the product of several powerful and mutually reinforcing forces that, taken together, have funnelled an extraordinary share of market capitalisation into a shrinking number of names.
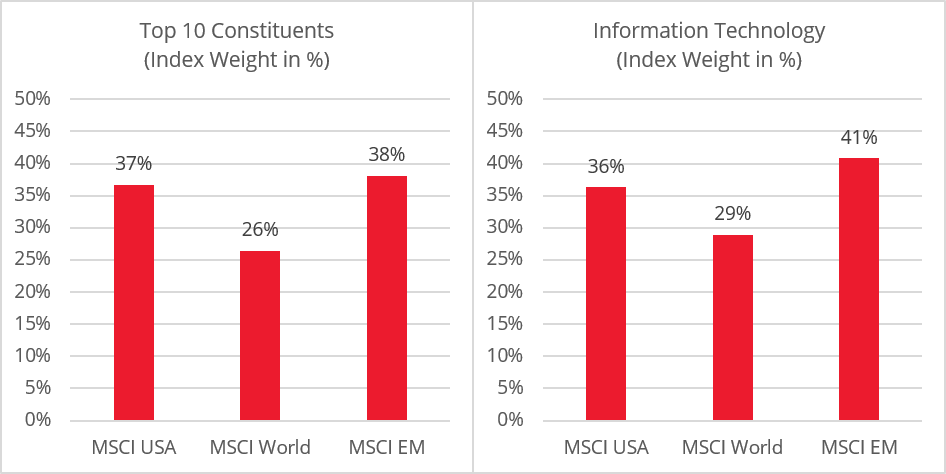
Across the MSCI USA, the MSCI World, and the MSCI Emerging Markets indices, the same pattern repeats: a shrinking number of names accounting for a growing share of total index weight, and a sectoral composition increasingly skewed towards technology at the expense of the broader economy. An investor who owns any of these indices passively is, in each case, making a far more concentrated bet than the index’s name suggests.
Charts 1 and 2: Major indices are highly concentrated and dominated by technology
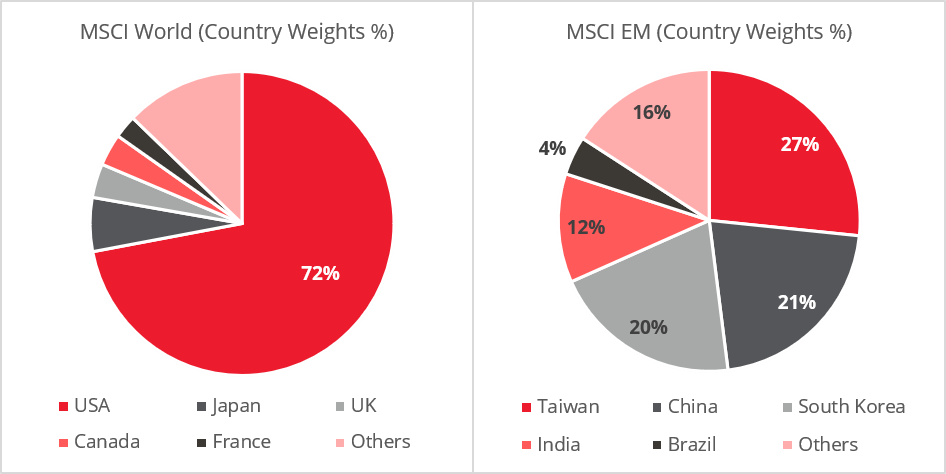
The concentration is not limited to individual names or sectors, it extends to geography as well. The MSCI World index, despite its name implying broad global exposure across 23 developed markets, allocates approximately 72% of its weight to a single country: the United States. The MSCI Emerging Markets index, an index nominally spanning the developing world from Latin America to South-East Asia is, in practice, almost half invested in just two economies, Taiwan and South Korea, both of which derive the overwhelming majority of their index weight from a single industry: semiconductor manufacturing.
In each case, the diversity suggested by the name has been quietly eroded by the mechanics of market-cap weighting.
Charts 3 and 4: The US, Taiwan and South Korea dominate global equity indices
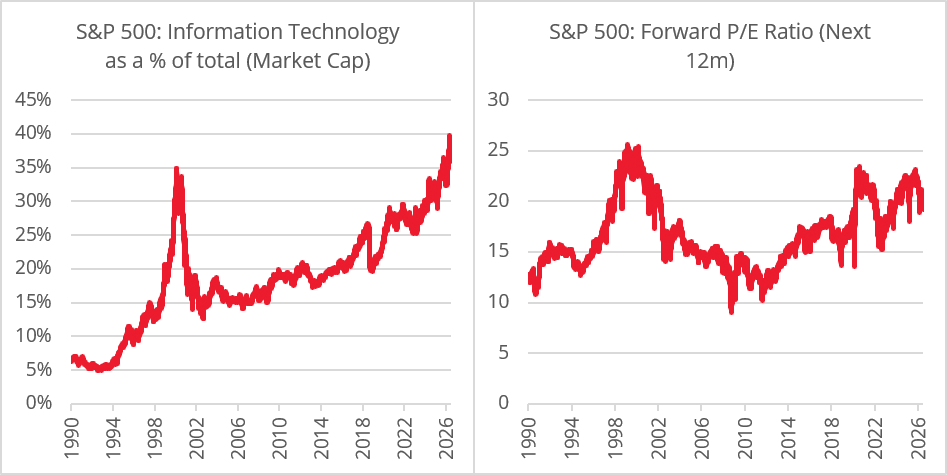
Concentration alone would be cause for concern, but combined with elevated valuations, it compounds into something considerably more serious: a market in which a small cluster of richly priced leaders exerts outsized influence on returns, leaving investors acutely exposed if sentiment toward those names shifts or their growth disappoints.
Charts 5 and 6: Both index concentration levels and valuations are elevated
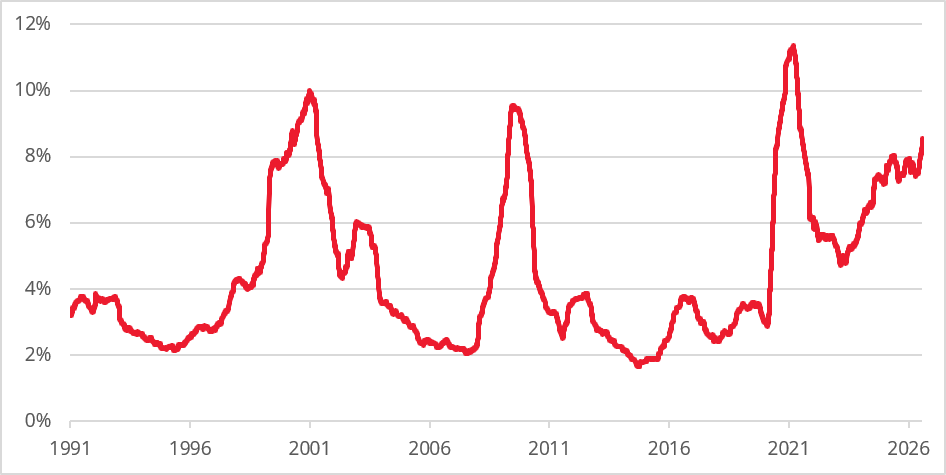
To illustrate this dynamic, we attempted to isolate – as cleanly as possible – the effect of benchmark concentration on tracking error, by examining how the return differential between the cap-weighted S&P500 and its equal-weighted counterpart has evolved over time. The exercise is instructive precisely because of its simplicity: both indices hold the same underlying stocks, and the only variable between them is the weight assig ned to each constituent. In theory, therefore, any tracking error that emerges between the two should reflect the effect of concentration. The chart below plots this relationship over time, and what it appears to suggest is that tracking error between the two versions of the same index has risen materially in recent years, broadly in line with the increase in concentration documented in the previous sections. If that interpretation is correct, it would imply that a meaningful portion of the tracking error observed in actively managed portfolios today may reflect not the riskiness of the manager’s active bets, but simply the growing distance between a diversified portfolio and an increasingly concentrated benchmark.
Past precedents, and where they fall in the timeline of financial history, are in themselves interesting to note.
Chart 7: Tracking error (rolling 12m): S&P500 Equal Weighted vs S&P500 Cap Weighted
Reframing tracking error: When deviation means diversification
When a benchmark is highly concentrated in a handful of expensive, correlated stocks, high tracking error does not necessarily signal bold active positioning, it may simply be the arithmetic consequence of holding a genuinely diversified portfolio. The converse is equally important, and more troubling: a low tracking error portfolio today implicitly embeds a large, concentrated bet on expensive technology mega-caps, whether its managers intended one or not.
Fund managers who decline to replicate the index and instead build a more evenly weighted portfolio of businesses trading at more reasonable valuations will generate material tracking error. Risk systems will flag it as anomalous, but the logic is sound: they are owning cheaper businesses, more diversely held, with less dependence on a single macro narrative. By the oldest definition of prudent investing, they may be taking less risk, not more.
When risk is in the benchmark
The argument set out in this piece is not merely theoretical. The Redwheel Global Intrinsic Value strategy is running a tracking error of 10.5% against its benchmark, a number that conventional risk frameworks would typically classify as high.1 And yet the performance profile that accompanies that tracking error tells a rather different story: an upside capture ratio in excess of 108%, meaning the portfolio has participated fully – and then some – in the market’s gains; and a downside capture ratio of approximately 50%, meaning that when markets have fallen, the portfolio has absorbed roughly half of those losses.[1]
That asymmetry is not accidental. It is the direct consequence of owning businesses purchased at a meaningful discount to their intrinsic value, companies where the price paid provides a structural cushion against adverse outcomes, while leaving the full benefit of equity ownership intact when conditions improve. Value, properly applied, is not a constraint on returns; it is a source of resilience. And resilience, in a market as concentrated and as expensively priced as the one we currently inhabit, is precisely what a conventional low-tracking-error portfolio systematically fails to provide.
The conventional framework tells investors that a fund with elevated tracking error is a risky fund. The evidence suggests the opposite: it is a fund that has declined to take the risks embedded in its benchmark, and when the benchmark itself is where the risk resides, that distance becomes a refuge.
Sources:
[1] Redwheel, 31 July 2026
Key Information
No investment strategy or risk management technique can guarantee returns or eliminate risks in any market environment. Past performance is not a guide to the future. The prices of investments and income from them may fall as well as rise and investors may not get back the full amount invested. Forecasts and estimates are based upon subjective assumptions about circumstances and events that may not yet have taken place and may never do so. The statements and opinions expressed in this article are those of the author as of the date of publication, and do not necessarily represent the view of Redwheel. This article does not constitute investment advice and the information shown is for illustrative purposes only.