








Convertible Bonds (Wandelanleihen) bieten eine hybride Lösung für Anleger, die ein ausgewogenes Engagement an den Finanzmärkten anstreben, welches die attraktiven Merkmale von Aktien und Anleihen kombiniert. Sie zielen darauf ab, in starken Marktphasen an Kursgewinnen teilzuhaben und gleichzeitig das Kapital in schwächeren Märkten zu schützen.
Emerging- und Frontier-Märkte-Strategien konzentrieren sich darauf, Wachstumschancen in den weltweit am schnellsten wachsenden Volkswirtschaften zu erschließen. Mit einem langjährigen, indexunabhängigen Ansatz investiert das Team sowohl direkt in diese Märkte als auch in Unternehmen aus den entwickelten Märkten, die dort ein bedeutendes Exposure haben.
Durch die Nutzung der Dividendenrenditen strebt das Redwheel Team an, mit Investitionen in ein diversifiziertes Portfolio globaler Aktien eine Kombination aus Erträgen und langfristigem Kapitalwachstum zu erzielen. Der Fonds richtet sich an Anleger, die einen disziplinierten Ansatz suchen und eine einzigartige Kombination aus überdurchschnittlicher Rendite, beständigen Erträgen und attraktiver Bewertung anstreben, während sie selektiv in übersehene Chancen investieren, bei denen kurzfristige Kontroversen zu potenziellen Fehlbewertungen geführt haben.
Ian Lance und Nick Purves führen das Global Intrinsic Value Team. Sie verfügen über mehr als 30 Jahre Erfahrung im Investmentbereich und arbeiten seit fast 20 Jahren gemeinsam in unterschiedlichen Marktzyklen. Mit ihrem Team globaler Analysten sind sie überzeugte Value-Investoren, die unterbewertete, zukunftsfähige Unternehmen mit starken Cashflows und soliden Bilanzen identifizieren.
Strukturelle Veränderungen, die durch neue Regulierungen, technologische Innovationen und die globale Energiewende vorangetrieben werden, schaffen langfristige Wachstumschancen in allen Infrastruktursektoren. Unsere börsennotierte Infrastrukturstrategie „Listed Infrastructure“ investiert in börsennotierte Unternehmen in Industrie- und Schwellenländern, die wesentliche Dienstleistungen und Anlagen bereitstellen, welche die Wirtschaftstätigkeit und die gesellschaftliche Entwicklung vorantreiben. Das Anlagespektrum umfasst Strom- und Gasversorger, Verkehrsinfrastruktur sowie Umweltdienstleister, die von der steigenden Stromnachfrage, der Dekarbonisierung und dem Elektrifizierungstrend profitieren dürften.
Unsere Natural Capital Strategie strebt langfristiges Kapitalwachstum an, indem sie in globale Unternehmen investiert, die zur Erhaltung und Wiederherstellung der natürlichen Ressourcen unseres Planeten beitragen. Während Ökosysteme trotz ihrer grundlegenden Bedeutung für die wirtschaftliche und gesellschaftliche Stabilität einem zunehmenden Druck durch Umweltverschmutzung und Ressourcenverknappung ausgesetzt sind, sehen wir in naturbejahenden Lösungen eine vielversprechende Chance.
Unsere Active-Ownership-Strategien basieren auf der Überzeugung, dass Unternehmen mit aktiven, engagierten Aktionären mit größerer Wahrscheinlichkeit überdurchschnittliche langfristige Renditen erzielen. Der Schwerpunkt der Strategien liegt auf Investitionen in konzentrierte Portfolios europäischer und japanischer Unternehmen, die offen für Engagement sind, wobei gezielt fundamental solide Geschäftsmodelle mit erheblichem Aufwärtspotenzial über einen Zeithorizont von drei bis fünf Jahren ausgewählt werden.

Bei Redwheel ist Stewardship unser übergeordneter Ansatz für verantwortungsbewusstes Investieren, der Nachhaltigkeit, Active Ownership sowie Greenwheel Research & Insights in einem einheitlichen, disziplinierten Rahmen vereint. Im Rahmen dieses Ansatzes integrieren wir wesentliche Nachhaltigkeitsaspekte in unsere Anlageentscheidungen, unterstützen unsere Investmentteams mit zentral gebündelter Expertise und nutzen gezieltes Engagement, Stimmrechtsausübung sowie thematische Analysen, um langfristige Kundenergebnisse zu schützen und zu verbessern.

For me, one of the best parts of the day is reading to my children at bedtime: settling into a comfortable chair and taking them on adventures into lands dreamed up in the fabulous imaginations of the finest authors. One staple is Roald Dahl, whose eccentric tales and kooky characters continue to delight around the world, with one of his books selling every three seconds.
A beloved classic and personal favourite is The BFG, the story of the eponymous Big Friendly Giant who teams up with a poor orphan girl, Sophie, to take down a troop of man-eating giants with the help of Her Majesty the Queen. Stirring, patriotic stuff.
One early scene shows our hero Sophie discovering all the strange details of the BFG’s life, and, with her tummy rumbling, the subject turns naturally to food. Here, the BFG shows Sophie the true price of his non-human eating ways:
„In this sloshfunking Giant Country, happy eats like pineapples and pigwinkles is simply not growing. Nothing is growing except for one extremely icky-poo vegetable. It is called the snozzcumber… I squoggle it! I mispise it! I dispunge it! But because I is refusing to gobble up human beans like the other giants, I must spend my life guzzling up icky-poo snozzcumbers instead”
Sophie’s initial reaction is denial, proclaiming that such a vegetable simply does not exist. The wise BFG gently reprimands her kneejerk scepticism, reminding her that:
“Yesterday we is not believing in giants, was we? Today we is not believing in snozzcumbers. Just because we happen not to have actually seen something with our own two little winkles, we think it is not existing.”
We have said it before, and we will say it again: all great works of art contain valuable lessons for the thoughtful investor – and fantastical children’s stories are no exception. The BFG’s gentle caution is as clear as it is fundamental: a lack of personal experience does not mean that something cannot happen, does not exist, or is beyond the realms of possibility.
Indeed, in decision-making theory, this is more formally captured by the availability heuristic, defined as:
“A judgmental heuristic in which a person evaluates the frequency of classes or the probability of events by availability, i.e., by the ease with which relevant instances come to mind” [1]
Today, many investors in our view are at risk of falling foul of this dangerous oversight, with one blind spot in particular: the continued exceptionalism of American equity returns.
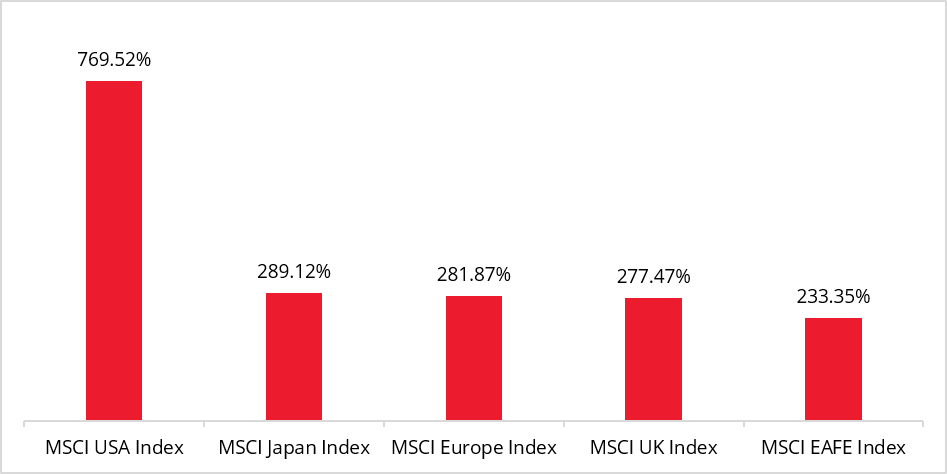
Most professional investors currently peddling their wares – your author humbly included – have lived and worked through a virtually uninterrupted period where one single trade dominated: buy America. In the last twenty years, the US equity market has resoundingly outperformed other major global markets, whether taken together – represented by the MSCI EAFE Index, which captures developed market returns outside of North America – or assessed separately.
Chart 1: Major markets – Total returns, 2006 – 2026
As a result, the idea that there could ever be a period during which US equities might underperform their international peers is as foreign to many investors as the snozzcumber was to Sophie. With no prior personal experience to think of, and no recent data pointing to the contrary, why would this prospect even cross their mind?
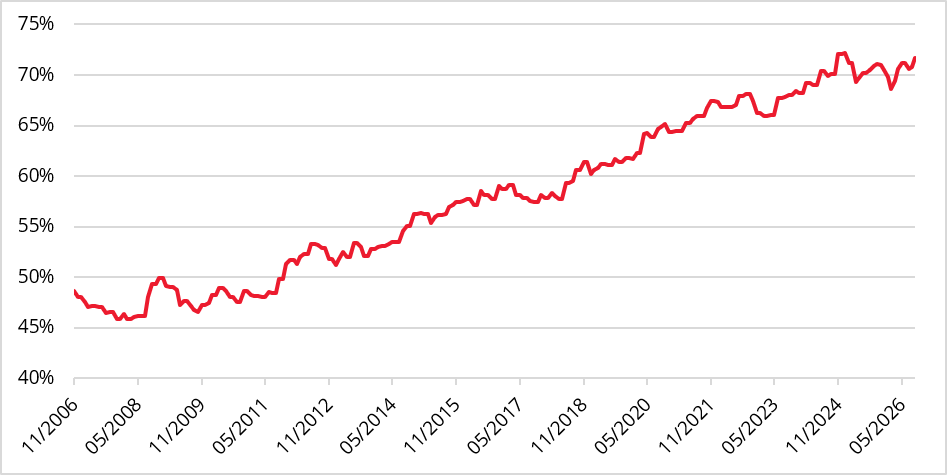
Many investors have seen their exposures to US companies balloon over time, rising to historically unprecedented levels. A cursory look at the composition of the MSCI World, the most widely used benchmark of global equity markets, will attest to that fact: today, the US comprises 71.7% of the global market [2], the culmination of a steady upward march over the past twenty years.
Chart 2: Weight of US stocks in the MSCI World Index, 2006 – 2026
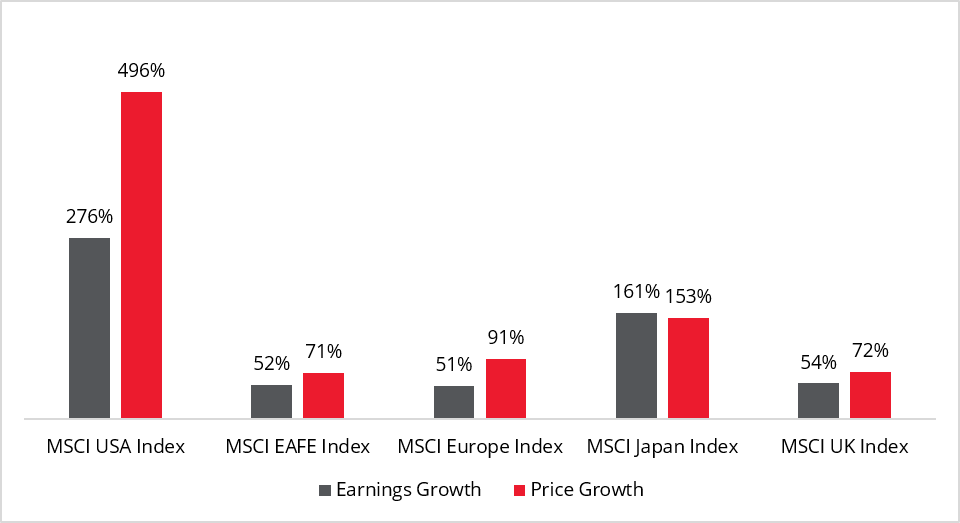
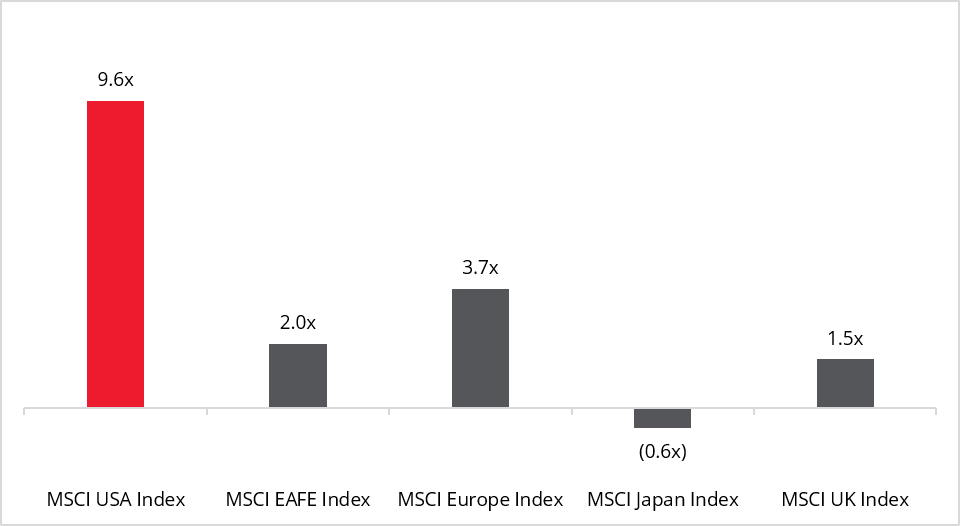
Whilst it is true that corporate America has delivered strong earnings growth and economic success, this outsized representation runs well ahead of their share of global GDP, which currently stands at a mere 25.6% [3]. Instead, the majority of the increase in global equity market weight has been driven by an increase in valuation, rather than earnings: investors have been, by and large, willing to pay more and more for each dollar of American earnings than international ones.
Comparing the cumulative growth of earnings for various markets with the growth in their valuations – how much investors are willing to pay for those earnings – makes this point even more explicit.
Chart 3: Major markets – Earnings and price growth, 2006 – 2026
Chart 4: Major markets – P/E multiple expansion, 2006 – 2026
In light of these seismic shifts, driven largely by changes in valuation, we believe that the cautious investor – cognisant of the ringing alarm bells in US equity valuations – must consider today whether the future may look different from the recent past.
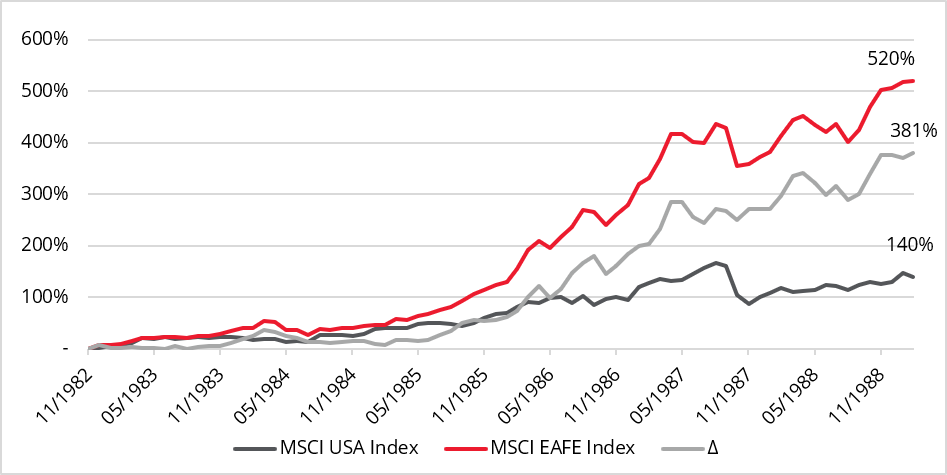
Although it has faded from memory, and certainly from headlines, there have in fact been sustained periods of time when US investors suffered years of substantial equity market underperformance, typically following the bursting of a large valuation bubble. For instance, at the end of the Nifty-Fifty era in the late 1970’s – when 50 US blue-chip companies such as Xerox, Polaroid and Revlon were seen as safe investments at any price – investors caught up in this enthusiasm with US companies saw the value of their shares plummet, and would spend the next six years trailing their international peers by nearly four hundred percentage points:
Chart 5: MSCI EAFE vs MSCI USA – Performance 1982 – 1989
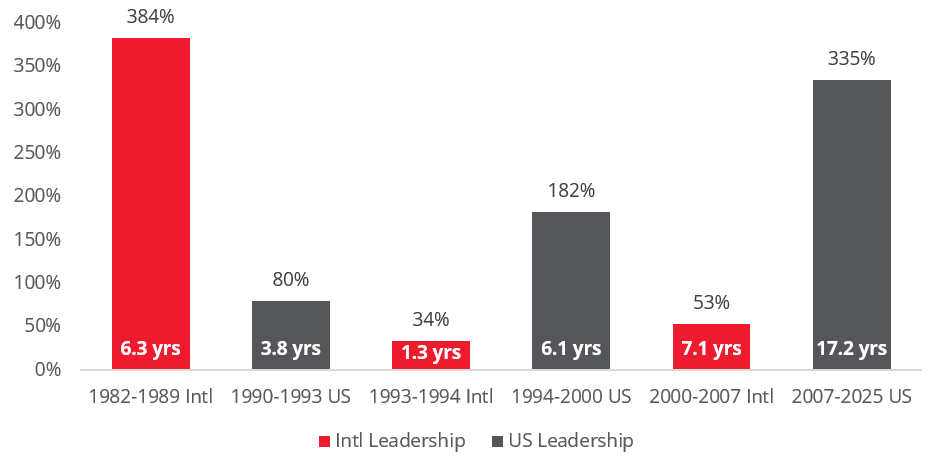
In fact, what the long-term record shows overall is a series of cycles, punctuated by gut-wrenching rotations that change the direction of over- or under-performance on a periodic basis. [4]
Chart 6: US vs EAFE – Performance cycles
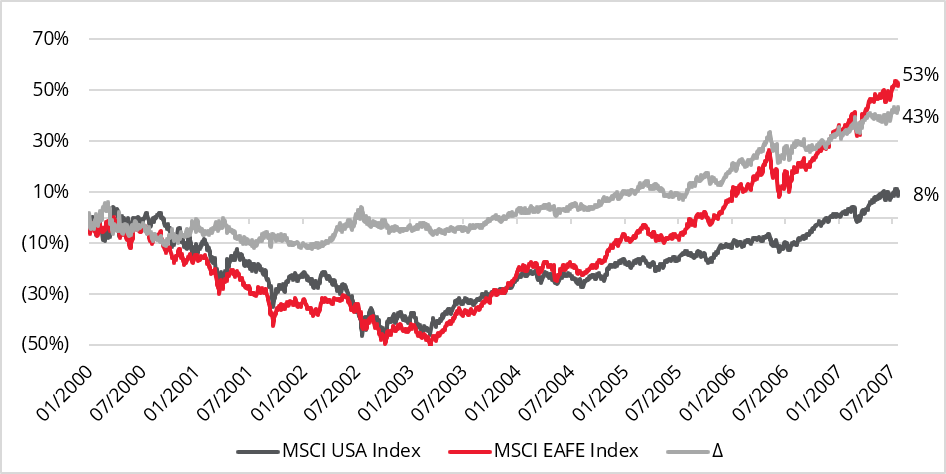
Today, we stand at a time in history when the share prices of US corporations have, in aggregate, outperformed their international peers for the longest stretch on record: 17.2 years and counting, eclipsing their prior run of 6.1 years, from 1994 – 2000, memorably a time of a large build-up of frothy valuation excess. As we have previously noted, US equity valuations today are abnormally elevated, sitting well above the Nifty Fifty era, and only a touch below the highs experienced just before the dotcom bubble burst in early 2000. Both events triggered a subsequent multi—year period of international outperformance against the US, with the start of the new millennium a similarly bleak time for US domestic equities.
Chart 7: MSCI EAFE vs MSCI USA – Performance, 2000 – 2007
We are not, of course, suggesting that investors flee from the US in its entirety, nor do we claim to be so prescient as to foresee what the next decade holds. However, our observations are merely that, whilst it may seem unconscionable to many, the US market can, and has, underperformed its international peers for many years in the past. With valuations as high as they are today, the risk of that repeating in the future is, at the very least, a genuine one, one which all investors would be prudent to consider.
Before we conclude, one final word of caution about the US market is worth considering. The current boom is being notably driven by ever fewer companies, a sign of an extraordinarily inefficient market propped up by myopic investors crowding into a waning number of trades and pushing the envelope of irrational exuberance. As this is being written, the clearest example yet of this phenomenon has presented itself: on Monday, September 21st – when the S&P 500 Index rallied to within 1% of its all-time high – more companies in the index fell to new lows than new highs [5]. There have only been two days in recorded history with similar dynamics at play: December 21st, 1999, and July 23rd, 1929, both pre-empting devastating and historic losses for US equity markets – and marking the start of years of international outperformance.
A positive corollary of this high degree of US dispersion – many companies seeing valuations fall, offset by a few huge winners – is that, for the discerning active investor willing to look hard, there is an increasing number of cheap opportunities emerging in the US. Indeed, the exposure to North America in our global strategy has increased through the course of 2026 – nearly doubling to ~44% today, but still well below the global index – as we feast on those companies left at the wayside of the technology boom.
*****
As the BFG cautions Sophie, it is incumbent on investors today to be mindful that, just because many today have never seen (with their own two little ‘winkles’) the US underperform for any meaningful stretch of time, it does not mean that this cannot come to pass. Indeed, we would argue that current corporate valuations, and increasing reliance on a handful of exceedingly popular companies, make that outcome more likely than not. As always, one man’s risk is another’s opportunity – and we believe that the opportunity for compelling returns lies, today, in cheap international markets.
Sources:
[1] Amos Tversky, Daniel Kahneman, Availability: A heuristic for judging frequency and probability, Cognitive Psychology, Volume 5, Issue 2, 1973
[2] Weighted by market capitalisation, data as of 23 September 2026; Source: Bloomberg, MSCI
[3] IMF World Economic Outlook, April 2026
[4] See ‘The case for international value’, Redwheel, June 2026
[5] Bloomberg, 21 September 2026
Key Information
No investment strategy or risk management technique can guarantee returns or eliminate risks in any market environment. Past performance is not a guide to the future. The prices of investments and income from them may fall as well as rise and investors may not get back the full amount invested. Forecasts and estimates are based upon subjective assumptions about circumstances and events that may not yet have taken place and may never do so. Portfolio holdings are subject to change without notice. The statements and opinions expressed in this article are those of the author as of the date of publication, and do not necessarily represent the view of Redwheel. This article does not constitute investment advice and the information shown is for illustrative purposes only.

Ecofin Portfolio Manager Michel Sznajer examines his strategy’s performance after previous peaks in bond yields and identifies potential takeover targets amid falling valuations and improving earnings prospects. Read his latest insight on the investment case for the sector—and the risks that could keep it under pressure.
Balanced convertibles are once again delivering meaningful equity participation while outpacing investment grade credit. Davide Basile, Portfolio Manager, Redwheel Convertible Bonds, argues that convertibles have reached a turning point, read more in his latest insight.
Two holdings in the Redwheel Global Equity Income strategy have agreed to be acquired this year, while a third has attracted takeover speculation – rare for a strategy invested in large, liquid companies. Nick Clay, Portfolio Manager, considers what this may reveal about the opportunity in durable businesses overlooked by a market fixated on a single theme.
Redwheel ® and Ecofin ® are registered trademarks of RWC Partners Limited (“RWC”). The term “Redwheel” may include any one or more Redwheel branded regulated entities including RWC Asset Management LLP, which is authorised and regulated by the UK Financial Conduct Authority and the US Securities and Exchange Commission (“SEC”); RWC Asset Advisors (US) LLC, which is registered with the SEC; RWC Singapore (Pte) Limited, which is licensed as a Licensed Fund Management Company by the Monetary Authority of Singapore; Redwheel Australia Pty Ltd is an Australian Financial Services Licensee with the Australian Securities and Investment Commission; and Redwheel Europe Fondsmæglerselskab A/S which is regulated by the Danish Financial Supervisory Authority.
Redwheel may act as investment manager or adviser, or otherwise provide services, to more than one product pursuing a similar investment strategy or focus to the product detailed in this document. Redwheel and RWC (together “Redwheel Group”) seeks to minimise any conflicts of interest, and endeavours to act at all times in accordance with its legal and regulatory obligations as well as its own policies and codes of conduct.
This document is directed only at professional, institutional, wholesale or qualified investors. The services provided by Redwheel are available only to such persons. It is not intended for distribution to and should not be relied on by any person who would qualify as a retail or individual investor in any jurisdiction or for distribution to, or use by, any person or entity in any jurisdiction where such distribution or use would be contrary to local law or regulation.
This document has been prepared for general information purposes only and has not been delivered for registration in any jurisdiction nor has its content been reviewed or approved by any regulatory authority in any jurisdiction.
The information contained herein does not constitute: (i) a binding legal agreement; (ii) legal, regulatory, tax, accounting or other advice; (iii) an offer, recommendation or solicitation to buy or sell shares in any fund, security, commodity, financial instrument or derivative linked to, or otherwise included in a portfolio managed or advised by Redwheel; or (iv) an offer to enter into any other transaction whatsoever (each a “Transaction”). Redwheel Group bears no responsibility for your investment research and/or investment decisions and you should consult your own lawyer, accountant, tax adviser or other professional adviser before entering into any Transaction. No representations and/or warranties are made that the information contained herein is either up to date and/or accurate and is not intended to be used or relied upon by any counterparty, investor or any other third party.
Redwheel Group uses information from third party vendors, such as statistical and other data, that it believes to be reliable. However, the accuracy of this data, which may be used to calculate results or otherwise compile data that finds its way over time into Redwheel Group research data stored on its systems, is not guaranteed. If such information is not accurate, some of the conclusions reached or statements made may be adversely affected. Any opinion expressed herein, which may be subjective in nature, may not be shared by all directors, officers, employees, or representatives of Group and may be subject to change without notice. Redwheel Group is not liable for any decisions made or actions or inactions taken by you or others based on the contents of this document and neither Redwheel Group nor any of its directors, officers, employees, or representatives (including affiliates) accepts any liability whatsoever for any errors and/or omissions or for any direct, indirect, special, incidental, or consequential loss, damages, or expenses of any kind howsoever arising from the use of, or reliance on, any information contained herein.
Information contained in this document should not be viewed as indicative of future results. Past performance of any Transaction is not indicative of future results. The value of investments can go down as well as up. Certain assumptions and forward looking statements may have been made either for modelling purposes, to simplify the presentation and/or calculation of any projections or estimates contained herein and Redwheel Group does not represent that that any such assumptions or statements will reflect actual future events or that all assumptions have been considered or stated. There can be no assurance that estimated returns or projections will be realised or that actual returns or performance results will not materially differ from those estimated herein. Some of the information contained in this document may be aggregated data of Transactions executed by Redwheel that has been compiled so as not to identify the underlying Transactions of any particular customer.
No representations or warranties of any kind are intended or should be inferred with respect to the economic return from, or the tax consequences of, an investment in a Redwheel-managed fund.
This document expresses no views as to the suitability or appropriateness of the fund or any other investments described herein to the individual circumstances of any recipient.
The information transmitted is intended only for the person or entity to which it has been given and may contain confidential and/or privileged material. In accepting receipt of the information transmitted you agree that you and/or your affiliates, partners, directors, officers and employees, as applicable, will keep all information strictly confidential. Any review, retransmission, dissemination or other use of, or taking of any action in reliance upon, this information is prohibited. Any distribution or reproduction of this document is not authorised and is prohibited without the express written consent of Redwheel Group.
Funds managed by Redwheel are not, and will not be, registered under the Securities Act of 1933 (the “Securities Act”) and are not available for purchase by US persons (as defined in Regulation S under the Securities Act) except to persons who are “qualified purchasers” (as defined in the Investment Company Act of 1940) and “accredited investors” (as defined in Rule 501(a) under the Securities Act).
This document does not constitute an offer to sell, purchase, subscribe for or otherwise invest in units or shares of any fund managed by Redwheel. Any offering is made only pursuant to the relevant offering document and the relevant subscription application. Prospective investors should review the offering memorandum in its entirety, including the risk factors in the offering memorandum, before making a decision to invest.
AIFMD and Distribution in the European Economic Area (“EEA”)
The Alternative Fund Managers Directive (Directive 2011/61/EU) (“AIFMD”) is a regulatory regime which came into full effect in the EEA on 22 July 2014. RWC Asset Management LLP is an Alternative Investment Fund Manager (an “AIFM”) to certain funds managed by it (each an “AIF”). The AIFM is required to make available to investors certain prescribed information prior to their investment in an AIF. The majority of the prescribed information is contained in the latest Offering Document of the AIF. The remainder of the prescribed information is contained in the relevant AIF’s annual report and accounts. All of the information is provided in accordance with the AIFMD.
In relation to each member state of the EEA (each a “Member State”), this document may only be distributed and shares in a Redwheel fund (“Shares”) may only be offered and placed to the extent that (a) the relevant Redwheel fund is permitted to be marketed to professional investors in accordance with the AIFMD (as implemented into the local law/regulation of the relevant Member State); or (b) this document may otherwise be lawfully distributed and the Shares may lawfully be offered or placed in that Member State (including at the initiative of the investor).
Information Required for Offering in Switzerland of Foreign Collective Investment Schemes to Qualified Investors within the meaning of Article 10 CISA.
This is an advertising document.
The representative and paying agent of the Redwheel-managed funds in Switzerland (the “Representative in Switzerland”) FIRST INDEPENDENT FUND SERVICES LTD, Feldeggstrasse 12, CH-8008 Zurich. Swiss Paying Agent: Helvetische Bank AG, Seefeldstrasse 215, CH-8008 Zurich. In respect of the units of the Redwheel-managed funds offered in Switzerland, the place of performance is at the registered office of the Swiss Representative. The place of jurisdiction is at the registered office of the Swiss Representative or at the registered office or place of residence of the investor.