










New evidence questions the assumptions on which growth investing is based

We have always tried to support our contention that value investing produces an above market return (and conversely that growth investing produces a below market return) with empirical evidence but some of the most often cited studies are now quite dated.

In December 1994, Josef Lakonishok, Andrei Shleifer and Robert Vishny (LSV) published a paper entitled ‘Contrarian Investment, Extrapolation and Risk’ which sought to explain why value strategies outperform the market. They concluded that ‘a likely reason that these value strategies have worked so well relative to the glamour strategies [1] is the fact that the actual future growth rates of earnings, cash flow, etc of glamour stocks relative to value stocks turned out to be much lower than they were in the past, or as the multiples on those stocks indicate the market expected them to be. That is, market participants appear to have consistently overestimated future growth rates of glamour stocks relative to value stocks’ [2]

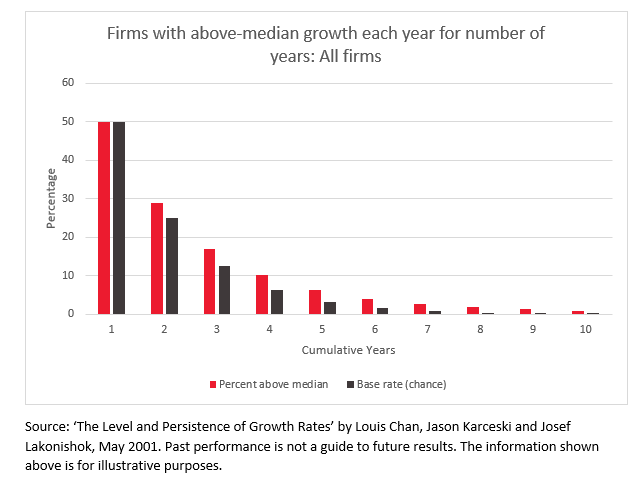
In May 2001, Josef Lakonishok, this time with Louis Chan and Jason Karceski, followed his earlier work by publishing a paper entitled ‘The Level and Persistence of Growth Rates’ [3] which went a step further in trying to explain the differential in returns between glamour and value stocks by testing whether company growth rates persist and whether they were forecastable. They concluded ‘there is scant persistence in growth beyond chance, and a limited ability to identify firms with high future long-term growth’. The result for all US stocks on the Compustat database is shown in the chart below which identifies the percentage of firms that can grow at an above average rate (year 1 is obviously 50%) and then shows what percentage of firms can maintain this above average rate for all cumulative years out to a ten-year period. The stark conclusion is that growth rates mean revert very rapidly.
To test whether it was possible to identify the small subset of firms that were able to grow at above average rates ex-ante, they repeated the experiment using subsets including stocks with superior historic growth rates, stocks with high valuations, technology stocks and small stocks. In all cases, the fade in growth rates was not materially different from the fade rate in all firms suggesting that it was not possible to identify, in advance, stocks with the ability to grow at above average rate.
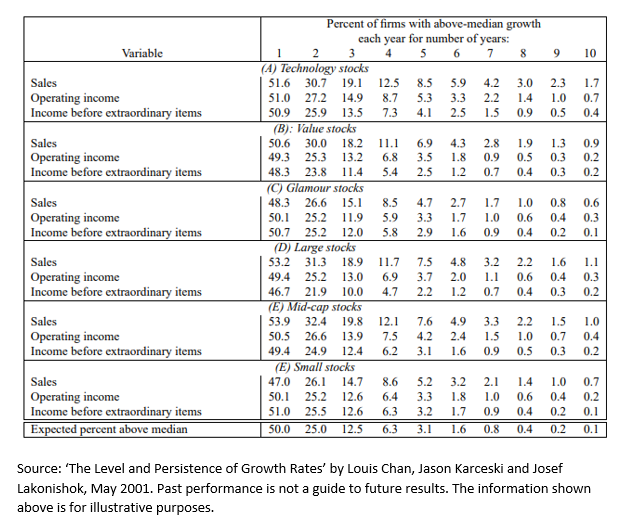
This point is key to understanding why glamour (or growth) stocks produce returns below the market average. Some investors exhibit behavioural biases such as over-confidence and recency bias that cause them to extrapolate trends and they pay high prices for companies with the highest historical growth rates and low prices for those that have lowest historical growth rates (see chart below).
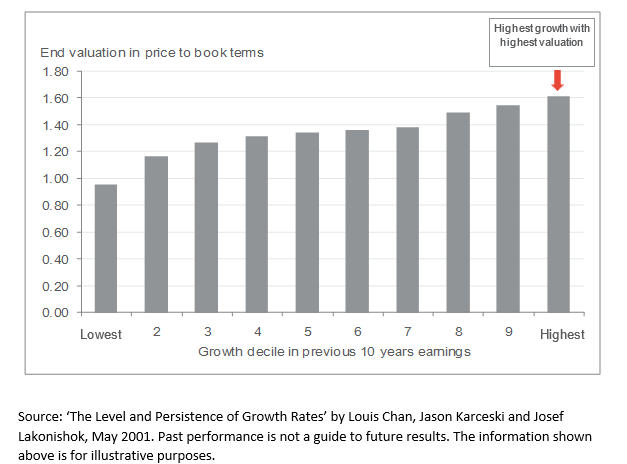
As the table above shows, it is incorrect to assume that firms with a high historical growth rate will show any persistence in the future. These firms therefore sometimes produce poor returns because as their growth rate slows, they fail to meet high expectations and de-rate. The combination of these factors depresses their total returns.

LSV attribute the outperformance to the failure of investors to formulate their predictions of the future without a “full appreciation of mean reversion.” That is, individuals tend to base their expectations on past data for the individual case they are considering without properly weighting data on what psychologists call the “base rate,” or the class average. Kahneman and Tversky (1982, p. 417 ) explain:

‘One of the basic principles of statistical prediction, which is also one of the least intuitive, is that extremeness of predictions must be moderated by considerations of predictability… Predictions are allowed to match impressions only in the case of perfect predictability. In intermediate situations, which are of course the most common, the prediction should be regressive; that is, it should fall between the class average and the value that best represents one’s impression of the case at hand. The lower the predictability the closer the prediction should be to the class average. Intuitive predictions are typically non-regressive: people often make extreme prediction on the basis of information whose reliability and predictive validity are known to be low.’ [4]

The outperformance of glamour or growth stocks in more recent years has been explained by some investors as a result of there being a new cohort of businesses which can ‘beat the fade’ because their scale and/or market position (the FAANG stocks epitomised this narrative). If true, this would invalidate the findings discussed above. We were therefore excited to see that the study by LSV was recently updated by Brian Chingono and Greg Obenshain of US based quantitative asset manager, Verdad, who examined the period 1997-2021 [5]. The authors noted that they ‘wanted to see how this finding has held up over the last 25 years, especially in light of the popular narrative of “secular changes” that have supposedly altered the economy—and the calculus of investing—in recent decades. We wanted to see if the higher valuations for growth stocks we’ve seen recently are justified by a higher level of persistence of growth rates.’

They started by noting that some investors still place high valuations on companies which have exhibited higher than average historical growth rates.

‘We can see evidence of this persistence assumption by looking at broad index data. The Vanguard US Growth Index consists of companies that have grown their earnings by 28% on average over the past five years. These growth stocks are priced at 29x their trailing net earnings, a 52% premium to the overall US market’s 19x Price/Earnings ratio. The average company in the US market portfolio has increased earnings by 20% annually over the past five years, an impressive number that seems to warrant similar discount rates between the overall market and growth stocks.’

Their findings (see tables below) were that the conclusions of LSV were still valid and that there remains little evidence of persistence in growth rates. On this basis, investors are still wrong to place higher valuations on companies with higher growth rates.
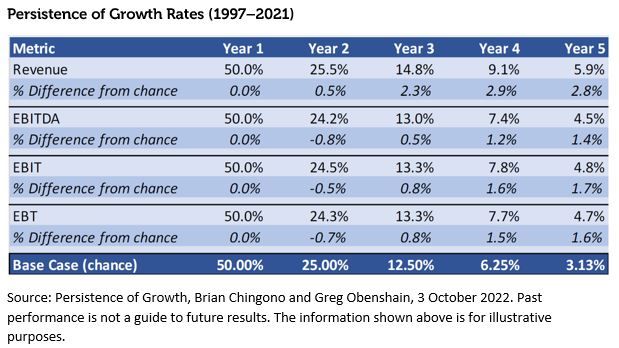
Repeating the methodology of LSV, they examined the cohort of companies which had the highest historical growth rates but again found little evidence of persistence.
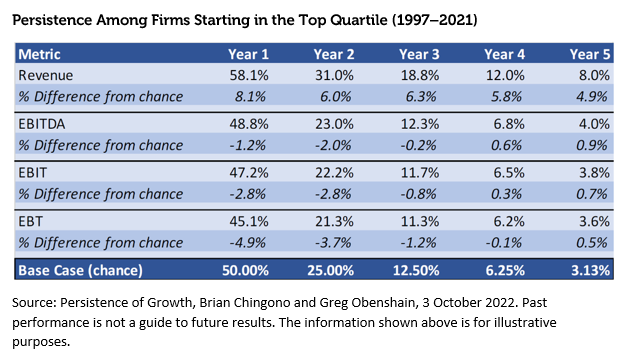
The authors conclude that ‘it seems that any secular changes in the economy over the past two decades have not changed the basic conclusion that earnings growth is not persistent beyond chance over the long term’

Conclusion

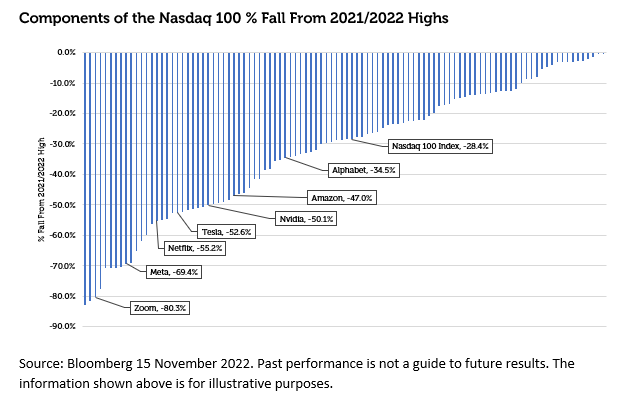
We continue to be perplexed that so many investors remain over-exposed to growth stocks given both the empirical evidence that they may produce below market returns in the long run as well the behavioural insights into why this is the case. Our assumption is that this is both a function of recency bias (growth stocks did well in recent years until 2022) combined with a very plausible narrative that a new cohort of companies existed which could beat the fade (of course a similar narrative existed during the Nifty Fifty Bubble of the Sixties and the TMT bubble of the Nineties). The evidence above suggests that this narrative is not supported by the data whilst the recent declines in share prices of growth stocks (see chart below) suggest an Emperors Clothes moment may have been reached. We continue to believe that the recent outperformance of growth was an aberration created by central bank monetary policy which is now reversing and that investors should be re-balancing towards value stocks.
Sources:

[1] Universe was divided into book-to-market deciles using COMPUSTAT data for the end of the previous fiscal year

[2]  ‘Contrarian Investment, Extrapolation and Risk’ by Josef Lakonishok, Andrei Shleifer and Robert Vishny December 1994

[3] ‘The Level and Persistence of Growth Rates’ by Louis Chan, Jason Karceski and Josef Lakonishok May 2001

[4] Judgement Under Uncertainty: Heuristics and Biases by Kahneman, Slovic and Tversky 1982

[5] Persistence of Growth by Brian Chingono and Greg Obenshain, Verdad, October 2022

Key Information
No investment strategy or risk management technique can guarantee returns or eliminate risks in any market environment. Past performance is not a guide to future results. The prices of investments and income from them may fall as well as rise and an investor’s investment is subject to potential loss, in whole or in part. Forecasts and estimates are based upon subjective assumptions about circumstances and events that may not yet have taken place and may never do so. The statements and opinions expressed in this article are those of the author as of the date of publication, and do not necessarily represent the view of Redwheel. This article does not constitute investment advice and the information shown is for illustrative purposes only.

In case you missed it

Global Intrinsic Value

Despite persistent outflows, global investor underweights and little direct exposure to the AI-led market rally, UK equities have generated strong relative returns. Larry Furness, Redwheel Value & Income, examines how low valuations, share buybacks, takeover activity and the recovery in value stocks have contributed to that outcome.

16 September, 2026 | 09:35am
Convertible Bonds

Davide Basile, Lead Portfolio Manager, Redwheel Convertible Bonds, marks the first year of Redwheel’s Enhanced Index Focus Convertibles strategy. He explores the case for balanced global convertible exposure and explains how the Strategy’s three implementation levers seek to offset fees and enhance net returns.

9 September, 2026 | 03:10pm

Growing electricity demand and security of supply concerns put geothermal energy in the solutions spotlight. Geothermal provides near‑zero‑emissions baseload and flexible power plus direct heat at stable operating costs, with minimal land footprint and no fuel inputs.

7 September, 2026 | 12:38pm

Disclaimer

Redwheel ® and Ecofin ® are registered trademarks of RWC Partners Limited (“RWC”). The term “Redwheel” may include any one or more Redwheel branded regulated entities including RWC Asset Management LLP, which is authorised and regulated by the UK Financial Conduct Authority and the US Securities and Exchange Commission (“SEC”); RWC Asset Advisors (US) LLC, which is registered with the SEC;  RWC Singapore (Pte) Limited, which is licensed as a Licensed Fund Management Company by the Monetary Authority of Singapore; Redwheel Australia Pty Ltd is an Australian Financial Services Licensee with the Australian Securities and Investment Commission; and Redwheel Europe Fondsmæglerselskab A/S which is regulated by the Danish Financial Supervisory Authority.

Redwheel may act as investment manager or adviser, or otherwise provide services, to more than one product pursuing a similar investment strategy or focus to the product detailed in this document. Redwheel and RWC (together “Redwheel Group”) seeks to minimise any conflicts of interest, and endeavours to act at all times in accordance with its legal and regulatory obligations as well as its own policies and codes of conduct.

This document is directed only at professional, institutional, wholesale or qualified investors. The services provided by Redwheel are available only to such persons. It is not intended for distribution to and should not be relied on by any person who would qualify as a retail or individual investor in any jurisdiction or for distribution to, or use by, any person or entity in any jurisdiction where such distribution or use would be contrary to local law or regulation.

This document has been prepared for general information purposes only and has not been delivered for registration in any jurisdiction nor has its content been reviewed or approved by any regulatory authority in any jurisdiction.

The information contained herein does not constitute: (i) a binding legal agreement; (ii) legal, regulatory, tax, accounting or other advice; (iii) an offer, recommendation or solicitation to buy or sell shares in any fund, security, commodity, financial instrument or derivative linked to, or otherwise included in a portfolio managed or advised by Redwheel; or (iv) an offer to enter into any other transaction whatsoever (each a “Transaction”). Redwheel Group bears no responsibility for your investment research and/or investment decisions and you should consult your own lawyer, accountant, tax adviser or other professional adviser before entering into any Transaction. No representations and/or warranties are made that the information contained herein is either up to date and/or accurate and is not intended to be used or relied upon by any counterparty, investor or any other third party.

Redwheel Group uses information from third party vendors, such as statistical and other data, that it believes to be reliable. However, the accuracy of this data, which may be used to calculate results or otherwise compile data that finds its way over time into Redwheel Group research data stored on its systems, is not guaranteed. If such information is not accurate, some of the conclusions reached or statements made may be adversely affected. Any opinion expressed herein, which may be subjective in nature, may not be shared by all directors, officers, employees, or representatives of Group and may be subject to change without notice. Redwheel Group is not liable for any decisions made or actions or inactions taken by you or others based on the contents of this document and neither Redwheel Group nor any of its directors, officers, employees, or representatives (including affiliates) accepts any liability whatsoever for any errors and/or omissions or for any direct, indirect, special, incidental, or consequential loss, damages, or expenses of any kind howsoever arising from the use of, or reliance on, any information contained herein.

Information contained in this document should not be viewed as indicative of future results. Past performance of any Transaction is not indicative of future results. The value of investments can go down as well as up. Certain assumptions and forward looking statements may have been made either for modelling purposes, to simplify the presentation and/or calculation of any projections or estimates contained herein and Redwheel Group does not represent that that any such assumptions or statements will reflect actual future events or that all assumptions have been considered or stated. There can be no assurance that estimated returns or projections will be realised or that actual returns or performance results will not materially differ from those estimated herein. Some of the information contained in this document may be aggregated data of Transactions executed by Redwheel that has been compiled so as not to identify the underlying Transactions of any particular customer.

No representations or warranties of any kind are intended or should be inferred with respect to the economic return from, or the tax consequences of, an investment in a Redwheel-managed fund.

This document expresses no views as to the suitability or appropriateness of the fund or any other investments described herein to the individual circumstances of any recipient.

The information transmitted is intended only for the person or entity to which it has been given and may contain confidential and/or privileged material. In accepting receipt of the information transmitted you agree that you and/or your affiliates, partners, directors, officers and employees, as applicable, will keep all information strictly confidential. Any review, retransmission, dissemination or other use of, or taking of any action in reliance upon, this information is prohibited. Any distribution or reproduction of this document is not authorised and is prohibited without the express written consent of Redwheel Group.

Funds managed by Redwheel are not, and will not be, registered under the Securities Act of 1933 (the “Securities Act”) and are not available for purchase by US persons (as defined in Regulation S under the Securities Act) except to persons who are “qualified purchasers” (as defined in the Investment Company Act of 1940) and “accredited investors” (as defined in Rule 501(a) under the Securities Act).

This document does not constitute an offer to sell, purchase, subscribe for or otherwise invest in units or shares of any fund managed by Redwheel. Any offering is made only pursuant to the relevant offering document and the relevant subscription application. Prospective investors should review the offering memorandum in its entirety, including the risk factors in the offering memorandum, before making a decision to invest.

AIFMD and Distribution in the European Economic Area (“EEA”)

The Alternative Fund Managers Directive (Directive 2011/61/EU) (“AIFMD”) is a regulatory regime which came into full effect in the EEA on 22 July 2014. RWC Asset Management LLP is an Alternative Investment Fund Manager (an “AIFM”) to certain funds managed by it (each an “AIF”). The AIFM is required to make available to investors certain prescribed information prior to their investment in an AIF. The majority of the prescribed information is contained in the latest Offering Document of the AIF. The remainder of the prescribed information is contained in the relevant AIF’s annual report and accounts. All of the information is provided in accordance with the AIFMD.

In relation to each member state of the EEA (each a “Member State”), this document may only be distributed and shares in a Redwheel fund (“Shares”) may only be offered and placed to the extent that (a) the relevant Redwheel fund is permitted to be marketed to professional investors in accordance with the AIFMD (as implemented into the local law/regulation of the relevant Member State); or (b) this document may otherwise be lawfully distributed and the Shares may lawfully be offered or placed in that Member State (including at the initiative of the investor).

Information Required for Offering in Switzerland of Foreign Collective Investment Schemes to Qualified Investors within the meaning of Article 10 CISA.

This is an advertising document.

The representative and paying agent of the Redwheel-managed funds in Switzerland (the “Representative in Switzerland”) FIRST INDEPENDENT FUND SERVICES LTD, Feldeggstrasse 12, CH-8008 Zurich. Swiss Paying Agent: Helvetische Bank AG, Seefeldstrasse 215, CH-8008 Zurich. In respect of the units of the Redwheel-managed funds offered in Switzerland, the place of performance is at the registered office of the Swiss Representative. The place of jurisdiction is at the registered office of the Swiss Representative or at the registered office or place of residence of the investor.