









This article was originally published in FT Adviser and can be accessed here.
Suck it up
One dark autumn evening in October 1978, a man drove home from work and proceeded to stick together some empty cereal boxes on his kitchen table. With ferocious intention, he constructed his paper prototype, tested that it worked, and – excited with his breakthrough – brought it to his bosses the following day, presenting his genius invention as the solution to their highly indebted manufacturing woes. They sneered at it, told him it would never work, and bid him good day.
Highly rankled, he immediately quit his job – despite having a wife, three children, and a large mortgage – and set about manufacturing the invention himself, working out of his one-light-bulb garage. For the next four years, utterly alone, he worked on refining his invention, ultimately building 5,127 prototypes before deciding that his device was production ready. This incredible productive stamina, however, was just the beginning of his entrepreneurial journey.
Having perfected his industry-leading design, he set out across the globe to find a partner willing to licence and build it, sparing him the expense of going even deeper into debt to build a manufacturing facility. Despite its obvious prowess, not a single company took his deal at first, choosing instead to politely but firmly tell him that it would never work, and he would be mad to continue to try to get it off the ground. It took him until 1986 before, finally, a Japanese company put his product onto the market under licence – eight long, penniless years of toil. However, even then, disappointment prevailed: the Japanese product limped along aimlessly, paying only the bare minimum royalties and by no means taking the world by storm. After endless similar frustrations with underperforming arrangements in America and the UK, this inventor eventually exited these agreements, and decided to go it alone.
In May 1992, after fourteen thankless and indebted years of hard work – throughout which he barely supported his family on the back of his brilliant invention – James Dyson finished his first Dyson Dual Cyclone, the first product that would be manufactured by Dyson Appliances – a company that he, and he alone, owned and controlled. In January 1993, the first production models rolled off the line, and by 1997 Dyson was the UK’s largest seller of vacuum cleaners. James Dyson was right: his invention, a bagless vacuum cleaner, was far superior to existing models, and consumers responded in droves, catapulting Dyson to a commanding position in the industry, ahead of all the companies that had declined to make his innovative contraption under licence.
Today, Dyson’s company sells over 20 million appliances around the world each year, bringing in nearly $9bn of annual sales and over $1bn in pre-tax income, spending more than $10m a week on research and development.[1] The entire of this world-beating empire is owned by James Dyson, as the sole shareholder, who took on the naysayers, and – against the odds – forged his own destiny.
Be the captain of your soul
As with many great stories, Dyson’s journey has profound lessons for today’s thoughtful investor: sometimes, when no one else recognises your value, you simply have to go it alone.
Let me segue somewhat to explain what I mean. Value investors are defined, broadly, by a desire to buy companies for less than their “intrinsic value”, a hard-to-quantify estimate of what the business, as a whole, is truly worth. This necessitates viewing buying a share on a stock exchange less as a piece of paper that fluctuates in price, and more as a minority ownership stake in a real operating business. Whilst it is hard to quantify in a precise formula, what drives the intrinsic value of a business are three principal items: what will the economic earnings of the business be, when will they arrive, and what should we consider those cash flows worth today?
As a result, the earnings of the business play a primary role in determining the company’s true worth, and thus – for bargain hunting value investors – is an excellent place to start when searching for cheapness. To do this, value investors often turn to proxies of cheapness: key metrics that indicate the potential presence of an underpriced earnings stream. Two of the most common are price to earnings (“P/E”) and price to book (“P/B”); price to earnings reflects how much, at the current share price, a single dollar of earnings will cost you, whilst price to book corresponds to how much a dollar of shareholder’s equity will cost you. At a low price to earnings – say, 5x – an investor is buying $1 of earnings for $5, or a 25% earnings yield on their money. More concretely, picture a chemical company, which earned an average of $1bn in net income over a ten year period; a long-run average tends to smooth the lumps and bumps of year-to-year fluctuations, and can often be a helpful guide to thinking about genuine underlying earnings power, what we refer to as “normalised earnings”. If our theoretical chemical company was being offered for sale at a market capitalisation of $5bn, that would represent a P/E of 5x, most likely indicating pessimism about whether the future of those earnings will look much like the past. By the same token, if the company had a book value – that is to say, the remaining value once all assets were sold, and all liabilities settled – of $10bn, then we would be buying the company at a P/B of 0.5x.
Value investors are drawn to these low ratios like moths to a flame, and the funds they manage often reflect this in a low weighted-average P/E or P/B across their portfolios. However, as a result, value investors like us are often asked the following question: why buy something just because it is cheap? What if it stays cheap? You might be right about its normalised earnings profile, but if no one wants to value the company more fairly – for example, increasing its P/E from 5x to 12x – how will you earn your keep? This is a fair question; after all, it is typically of no consolation that one has purchased a bargain if that bargain remains purely theoretical.
There are two equally valid answers to this valid question: earnings growth, and intelligent corporate capital allocation.
The first is simple enough: if we buy something at 7x earnings, and those earnings grow at 10% per annum, then we would hope to earn at least that 10% rate of return, even if the market continues to award its measly 7x valuation multiple. Ideally, of course, should that price revert to something reflecting a fair discount rate – perhaps 12x earnings [2] – then we would be delighted to earn that additional return, too.
But there is another path by which undervalued companies can earn investors an excess return, and it is here that the lessons of James Dyson come into play: taking matters into their own hands. In the spirit of Sir James, if the market does not fairly reflect the value you have, then you must go it alone – and, in doing so, the value that you can create can be very real indeed. After all, whilst it may be ignored by investors, the cashflow generated by a company is nonetheless comprised of cold, hard cash – cash which can be deployed for very real purposes. Using that cash to directly give shareholders a return, then, is a tangible pathway to value creation and realisation for the patient shareholder, even if the market remains stubborn, and refuses to increase the valuation of your company.
Take again, for example, our theoretical company valued at 7x earnings, and again assume that the market affords it no preponderance of love: after five years, that valuation is still just 7x earnings. What is the return that shareholders will have made?
As is so often the case in life, that very much depends. Our return will ultimately come down to how the company uses the earnings that it has generated over the period. If we pessimistically believe that the management team can’t find any high-returning internal projects for which that cash can be used, they have the option to either let that cash accumulate on the balance sheet (not an activity we would hope to see in the absence of a clear need), or they can distribute it out to shareholders – and it is here where the compounding magic happens.
The benefits of a low valuation are that you are afforded the opportunity to buy out your more disinterested partners at extraordinarily compelling prices: buying back your shares at 7x earnings, for example, is the equivalent of investing to boost per-share earnings by 16.7% [3], a return profile that we, at least, would view extremely favourably. Should a management team prove willing and able to buy out their misanthropic equity holders at this measly price, they will consistently boost per-share earnings over time – even with no growth in the net income of the business as a whole. Should their rating remain the same, then, this buyback-driven earnings growth will fuel a rise in the valuation of the individual shares, which is what remaining investors continue to own, even as the valuation for the entire company remains the same. Similar return dynamics can be achieved via cash dividends distributed to shareholders, and, in reality, the best management teams take advantage of both.
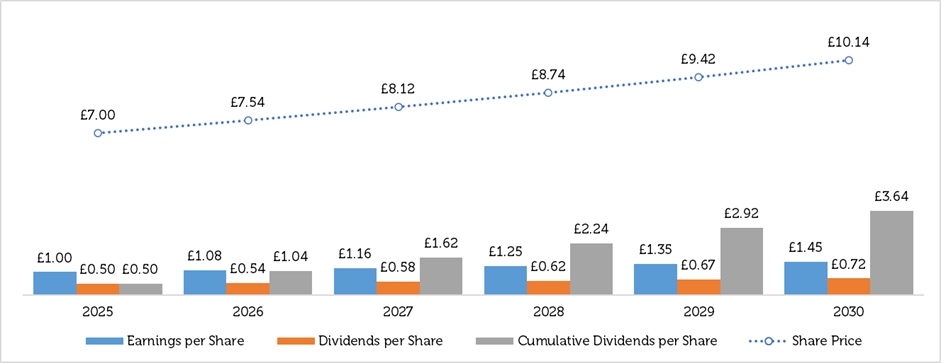
Presented below is a simple worked example, with a company constantly valued on 7x earnings, allocating 50% of its net income to buybacks, and 50% to cash dividends; the annualised total return on this investment – with no increase in valuation rating, mind, and no corporate-level earnings growth – is 17.4% p.a.:
Chart 1: Capital allocation drives investment returns
Whilst this is all well and good in practice, you need not take our word for its efficacy. Many companies today (yes, including many that we own) are active acquirers of their own cheap shares, and payers of profuse cash dividends, actions we applaud when more compelling internal opportunities do not present themselves. One company, in particular, is a poster child for Dyson-like self-determination.
The little department store that could
Clearly, there is something in the entrepreneurial waters of Arkansas. As well as birthing the Bentonville behemoth Walmart, Arkansas’ state capital (Little Rock, for those who don’t remember their high school geography) was the founding place of the department store Dillard’s, founded in 1938 by the eponymous Mr. Bill Dillard. Today, the company remains controlled and run by the founding family: Bill Dillard II has been running the show as CEO and Chairman since 2002, and he and the disparate Dillard clan still own 35% of the company.[1] Thinking like an owner is, therefore, a little more than a tagline to him.
Ordinarily, an old-school brick and mortar department store – pressured by giants such as Amazon and Walmart, and fending off the challenges of online shopping – would not be an obvious place to seek strong investment outperformance. And yet, as a result of consistently intelligent capital allocation decisions, that is exactly what an enterprising shareholder would have found in the Southern retailer.
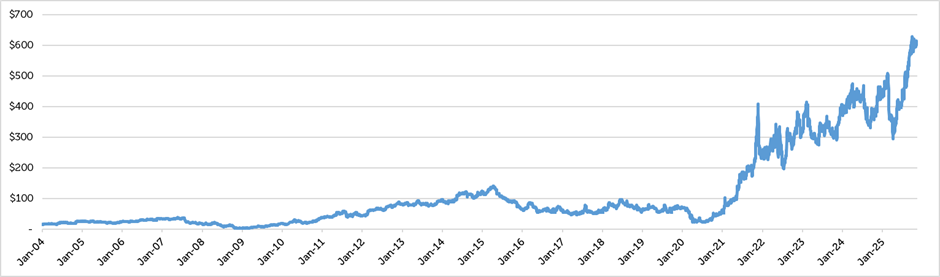
Twenty years ago, Dillard’s sported a market capitalisation of $1.4bn, yet since then the company has distributed $6.6bn to shareholders, in the form of $4.8bn of share buybacks – reducing the diluted share count by 81% over the period – and $1.8bn in cash dividends. Despite having less revenue today than it had in 2004, and losing nearly 20% of its store count in that time, Dillard’s has generated total shareholder returns of 18.6% annually over the past two decades – meaning that $10,000 invested at the time would now be worth nearly $420,000, a spectacular (and index-beating) achievement.[2] This achievement is all the more impressive in light of the fact that Dillard’s has actually experienced a de-rating in the value of its shares, from a P/E of ~40x trailing earnings in 2004 to ~17x today.
Chart 2: Dillard’s capital returns and diluted share count, FY04 – 9m 25
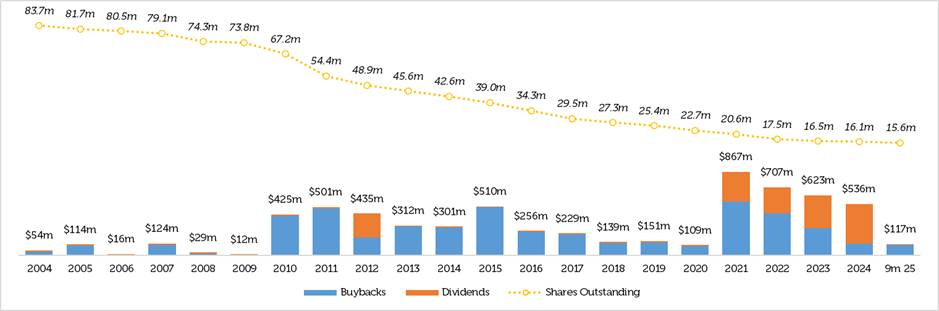
Chart 3: Dillard’s share price, FY04 – 9m 25
What this example serves to show is that a disciplined approach to buying undervalued companies – even where that market undervaluation may persist or worsen – can, with the right dose of capital allocation, still prove an immensely fertile ground to seek out excess shareholder returns. Taking matters into your own hands, then, counts as much in markets as it does in manufacturing.
What works for electronics works for equities
The good news for investors is that we can learn the lessons of James Dyson’s struggle without enduring the years of penniless toil. What he exemplified, and what his success bears testament to, is the singular achievements that are possible when one understands the value of what is being produced – whether carpet cleaners or cash – and determines to see that value realised.
For Dyson, taking matters into his own hands was a slow revelation, and still entailed decades of hard work to build and scale what is today a formidable industrial enterprise. For investors, happily, all that is needed to learn the same lessons, and reap the same rewards, is to find undervalued companies whose managers think, act, and allocate like owners. These managers recognise that the market does give them due credit for their true earnings power, but – unwilling to rely on simply changing the minds of fickle Wall Street analysts – they utilise their earnings power to be the masters of their own investment fate.
Key Information
No investment strategy or risk management technique can guarantee returns or eliminate risks in any market environment. Past performance is not a guide to the future. The prices of investments and income from them may fall as well as rise and investors may not get back the full amount invested. Forecasts and estimates are based upon subjective assumptions about circumstances and events that may not yet have taken place and may never do so. The statements and opinions expressed in this article are those of the author as of the date of publication, and do not necessarily represent the view of Redwheel. This article does not constitute investment advice and the information shown is for illustrative purposes only.
References
[1] Dyson company reports and accounts, February 2026.
[2] Reflecting a company growing per-share earnings at 3.0% per annum, and discounting those earnings at 12.5%
[3] Buying back 14.3% of your share count (100% of earnings directed to a buyback at 7x earnings) increases your per-share earnings by 16.7% the following year
[4] Redwheel/ Dillard’s Company reports and accounts as at February 2026.
[5] Dillard’s Company reports and accounts as at February 2026.