









10 reasons to allocate to emerging markets

The primary justifications for exposure to emerging market equities have generally included faster growth with lower valuations than developed markets, with the benefit of diversification. Cheap valuations and low correlations remain a core attraction, and growth should improve as monetary policy is eased. GDP growth in emerging markets is currently estimated at 4.3% in 2024, far higher than the 1.7% forecast growth rate for developed economies – see the first chart below.

In addition to strong growth potential and attractive valuations, we argue that several other factors support the case for investors increasing their exposure to emerging markets. First, emerging market currencies are undervalued relative to the US dollar compared to prior market cycles. Second, emerging markets have historically outperformed over multi-year cycles. We anticipate that numerous potential catalysts, including rising commodity prices, the end of deflation and economic reforms may lead to a future period of outperformance. Third, many emerging economies are enacting pro-growth initiatives, and their debt burdens are generally less onerous than developed nations; these factors should provide further tailwinds.

From a portfolio construction perspective, an emerging market allocation can offer valuable diversification benefits as the asset class exhibits low correlations against other regional equity indices. In our view, this can drive additional alpha in a global equity portfolio. Positioning data provided below suggest that most global investors are currently underweight the asset class; however, we believe that a combination of the above factors may catalyze a rotation toward emerging markets (EM).

1. Emerging market growth is stronger
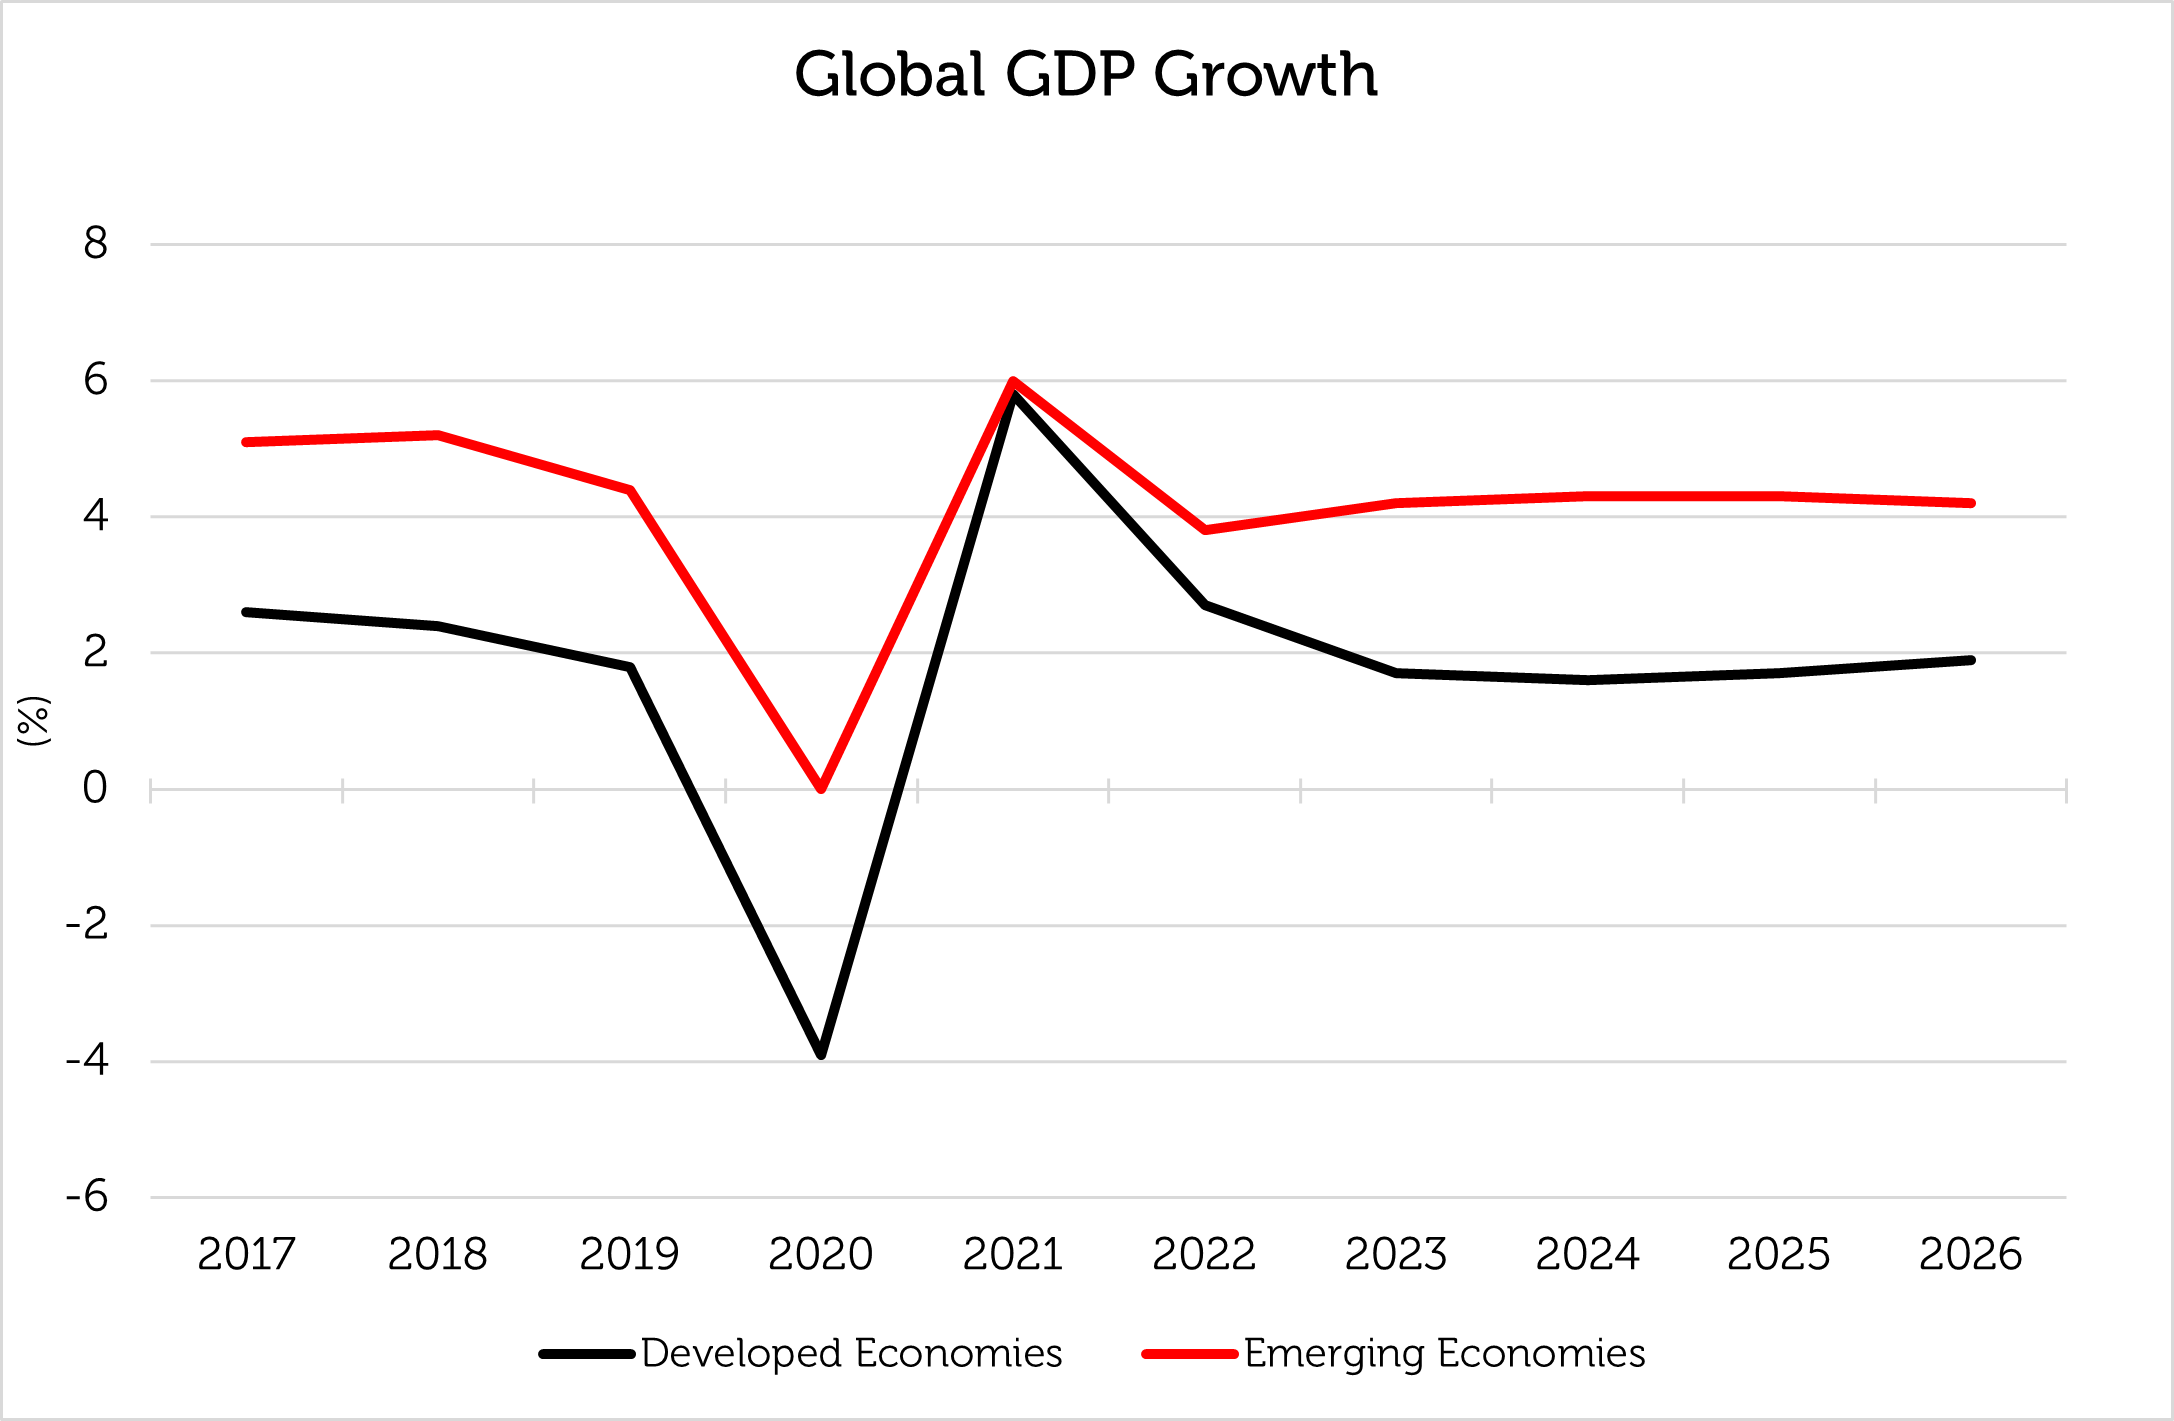
Source: Bloomberg 30 June 2024. The information shown above is for illustrative purposes. Past performance is not a guide to future results. 2024 to 2026 are estimates. Forecasts and estimates are based upon subjective assumptions about circumstances and events that may not yet have taken place and may never do so.

The key to more robust growth is lower inflation, which will allow central banks to reduce policy rates. Inflation has been caused by a combination of supply bottlenecks and pent-up consumer demand after the COVID-19 pandemic, spurred by government spending on infrastructure and social programmes. With inflation reverting to its pre-pandemic norm, we believe that central banks will begin cutting interest rates in the second half of 2024.
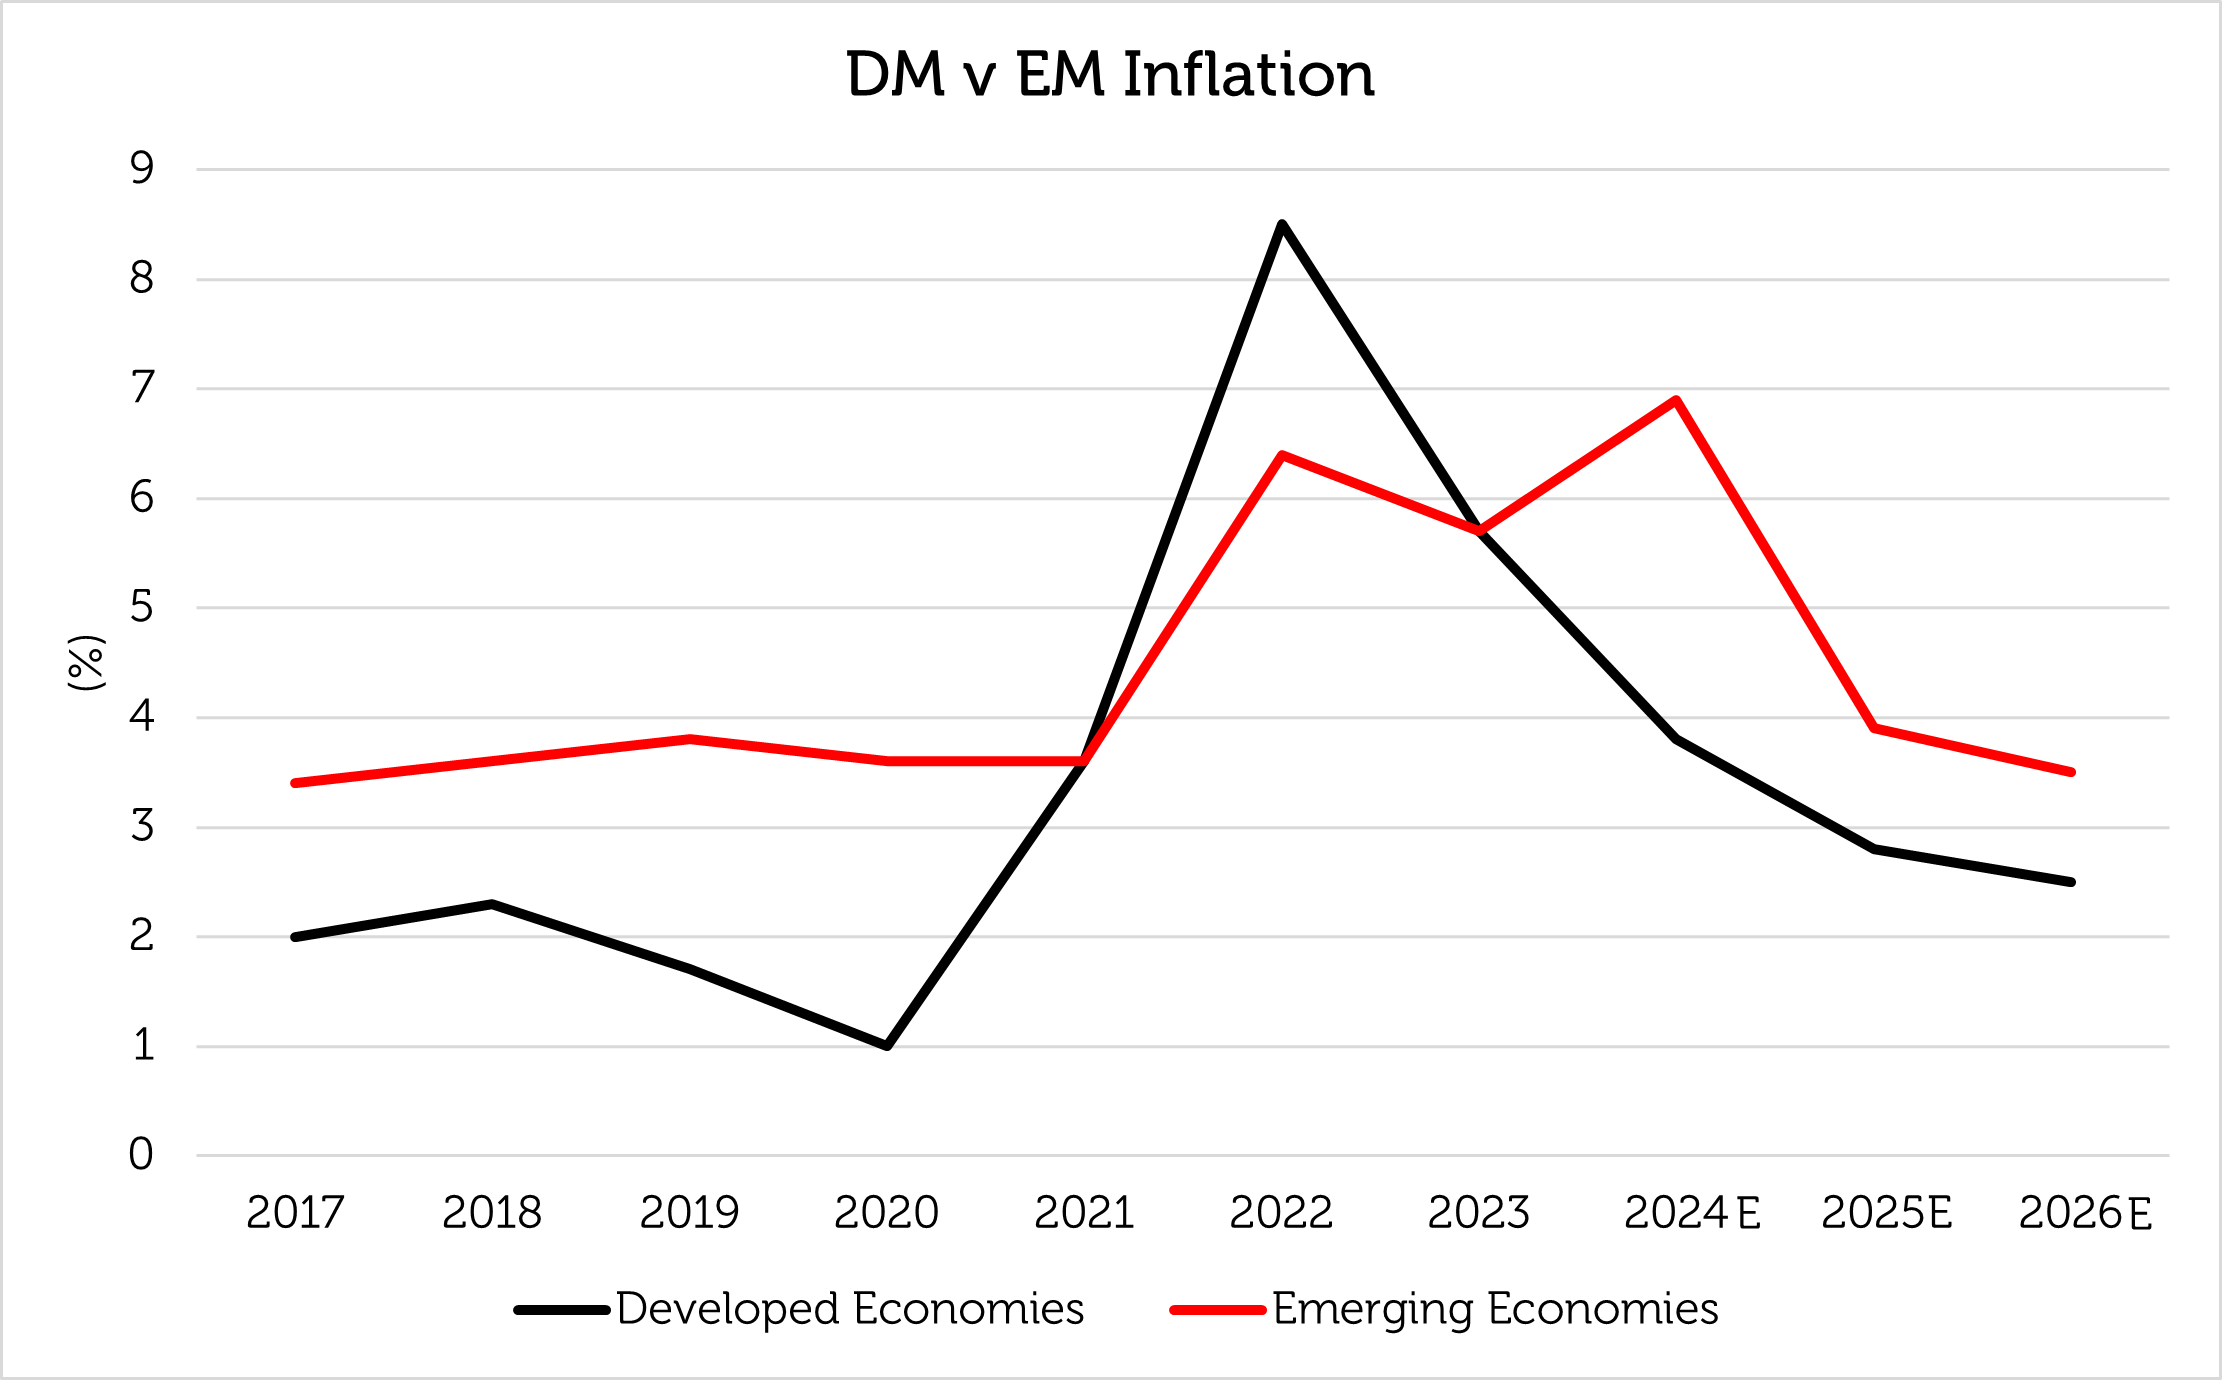
Source: Bloomberg as of 30 June 2024. The information shown above is for illustrative purposes. Past performance is not a guide to future results. 2024 to 2026 are estimates. Forecasts and estimates are based upon subjective assumptions about circumstances and events that may not yet have taken place and may never do so.

2. Emerging markets have cheaper valuations

Emerging market equities have been valued more cheaply than global equities ever since the rebound from the Global Financial Crisis (GFC) in 2008, with the discount widening for over a decade [1] – see the chart below.
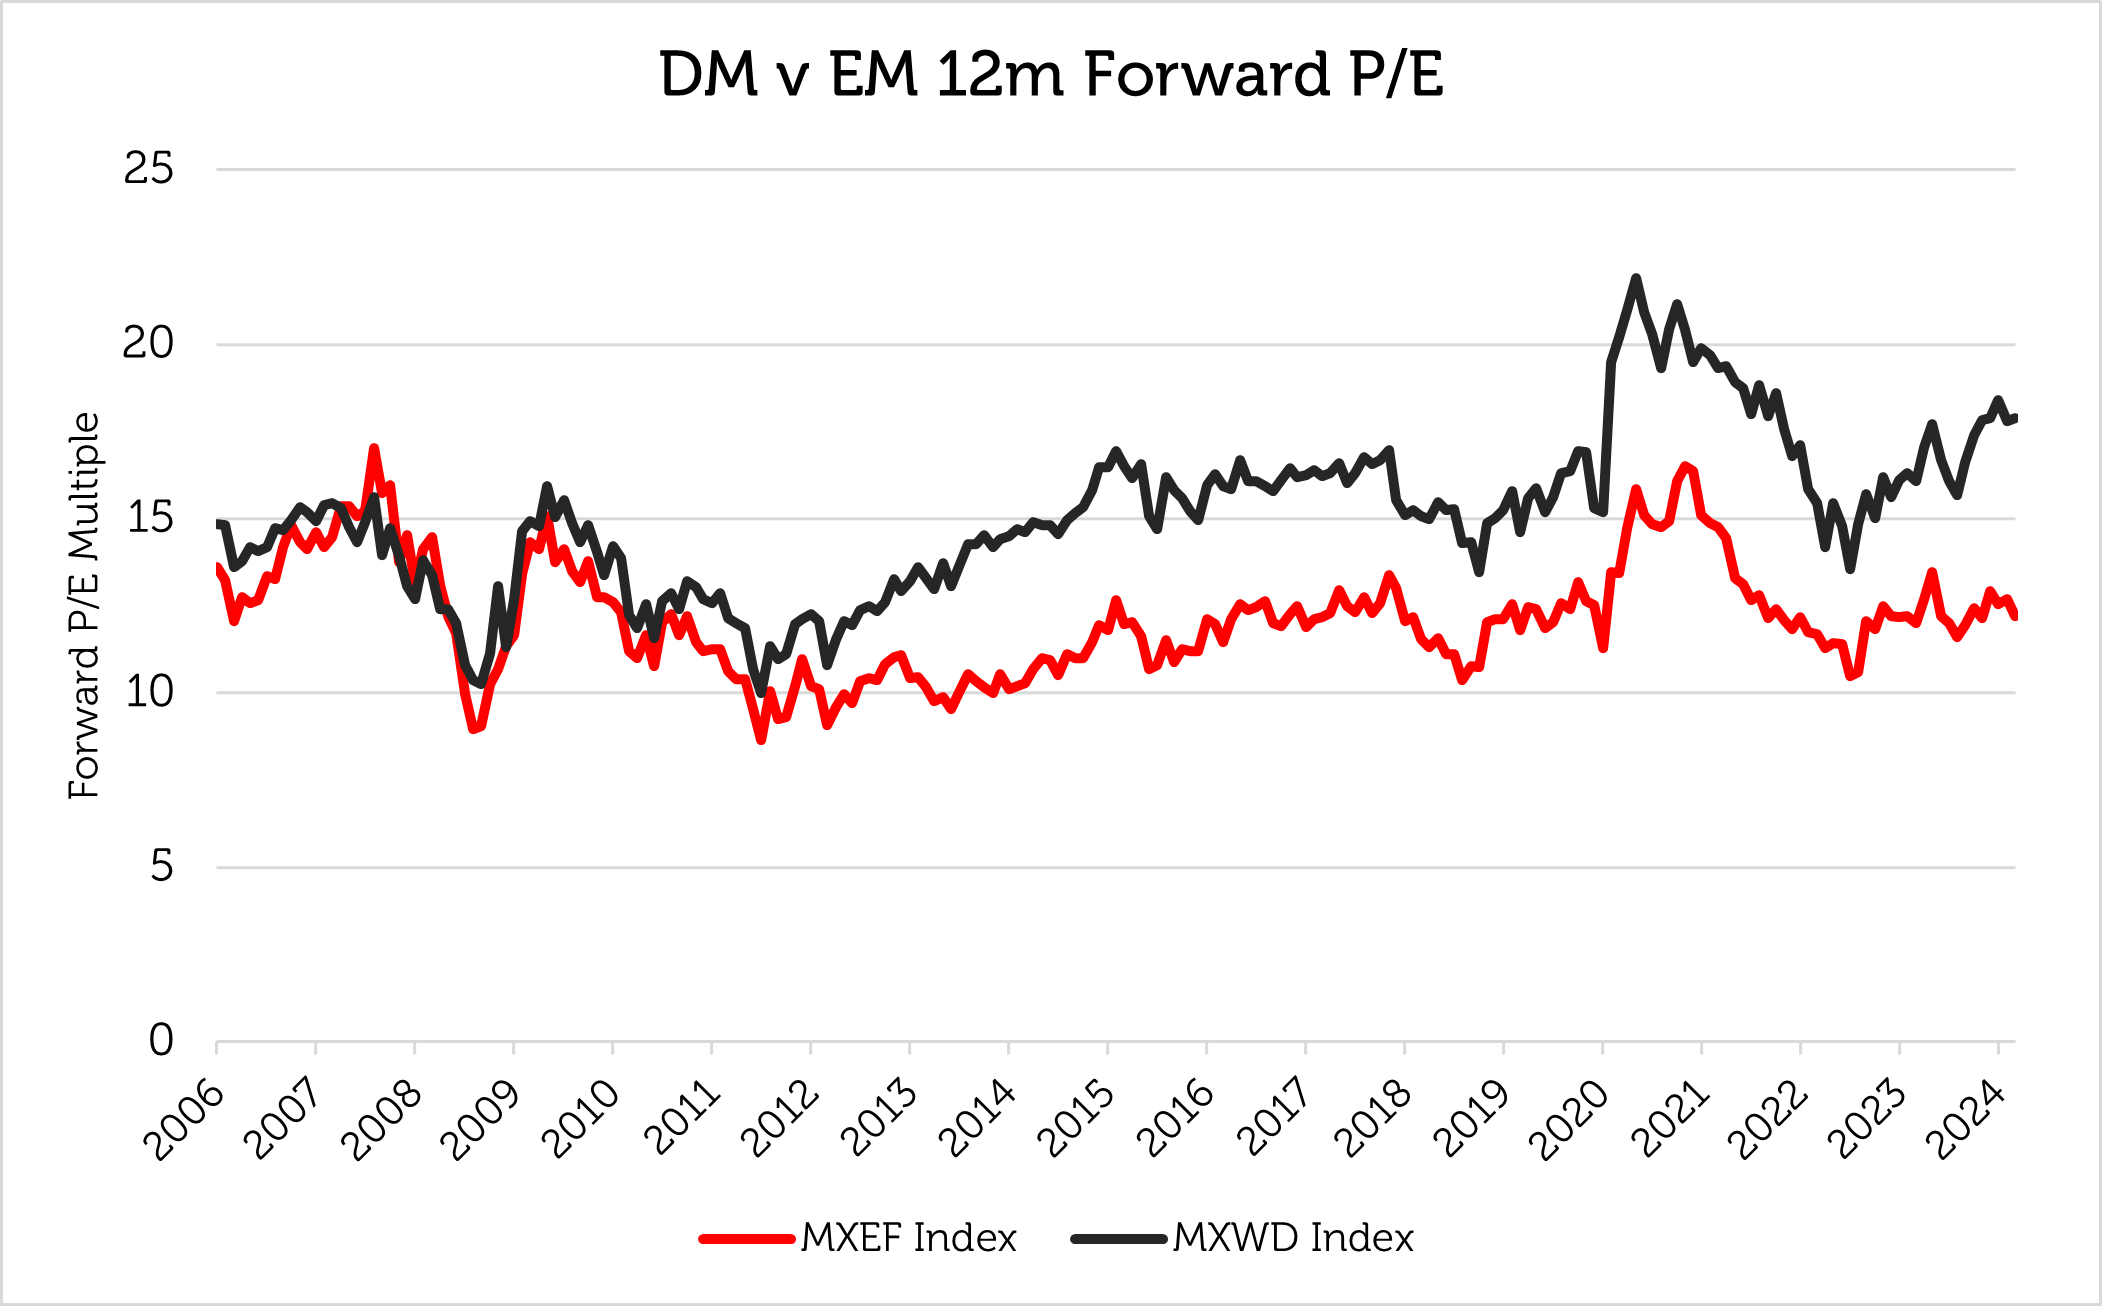
Source: Bloomberg as of 30 June 2024. MXEF Index is the MSCI Emerging Markets Index. MXWD Index is the MSCI All Country World (ACWI) Index. Uses 12-month forward consensus estimates. The information shown above is for illustrative purposes. Past performance is not a guide to future results. Forecasts and estimates are based upon subjective assumptions about circumstances and events that may not yet have taken place and may never do so.

Source: Bloomberg, 31 March 2006 – 30 June 2024. The information shown above is for illustrative purposes. Past performance is not a guide to future results.

The discount on the price / earnings metric has widened between the MSCI ACWI and MSCI Emerging Markets Indices to an above average level of 30% – see the chart and table above, principally because of the premium multiple that has been assigned to the MSCI ACWI benchmark global index, which includes the richly valued US market. The valuation gap is related to company earnings; the chart below shows how emerging market corporate earnings growth has diverged from developed market earnings since monetary policy was tightened in 2021, but this gap should close as central banks lower rates later this year.
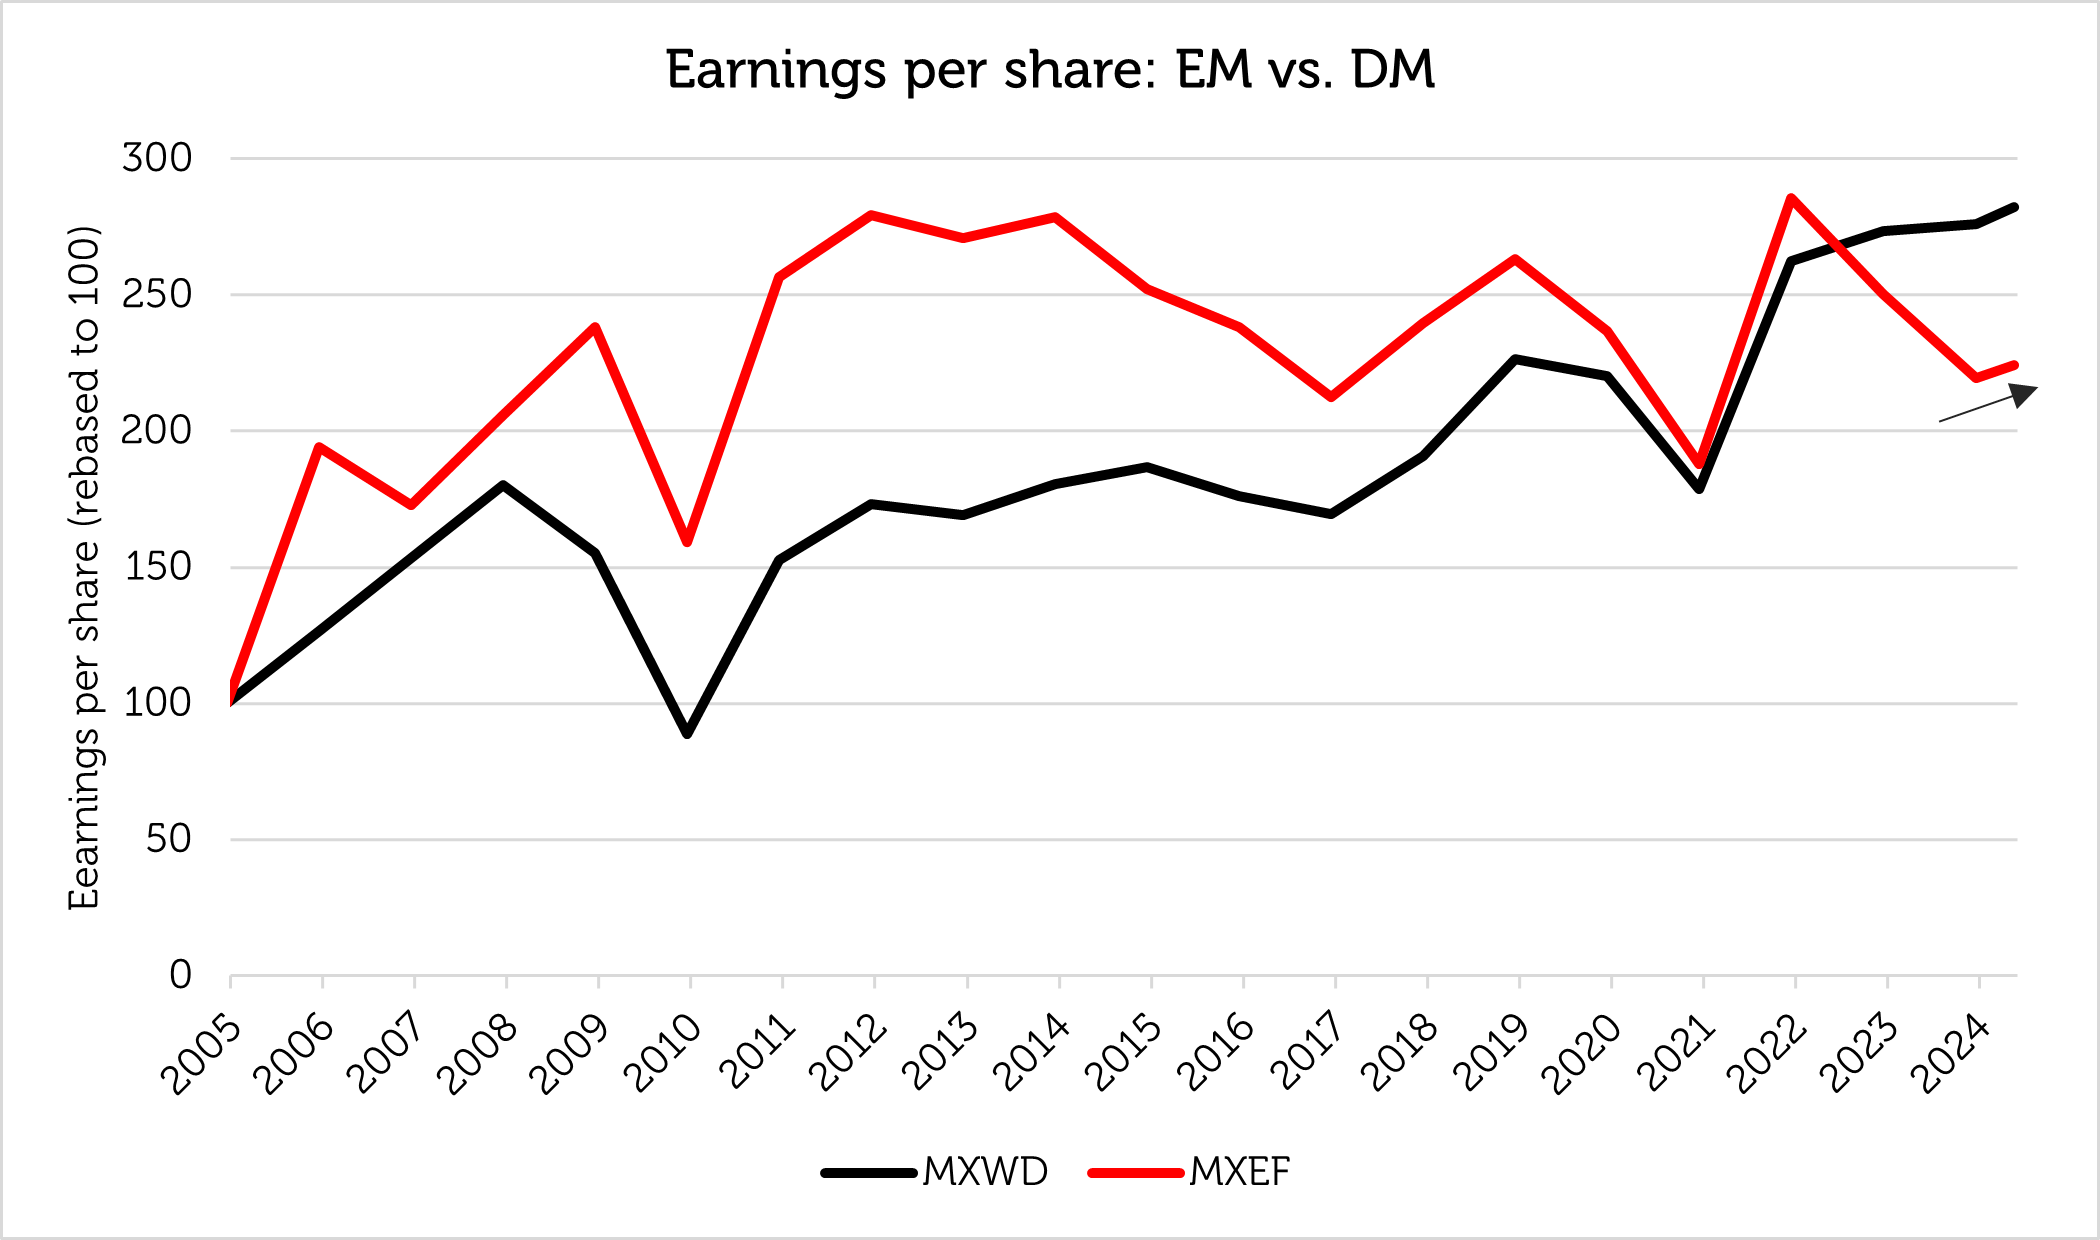
Source: Bloomberg as of 30 June 2024. The information shown above is for illustrative purposes. Past performance is not a guide to future results. Normalised to 100 %.

3. Emerging market currencies are cheap

It’s not just emerging market equities that are cheap; currencies are cheap, too. The Bloomberg Emerging Market Currency Index has fallen to its lowest level since its inception. As can be seen in the chart below, the Bloomberg Emerging Market Currency Index strengthened against the US dollar both during the super-cycle of the 2000s and the recovery after the GFC. What is required is accelerating growth, which we think can occur once interest rates are reduced in the second half of 2024.
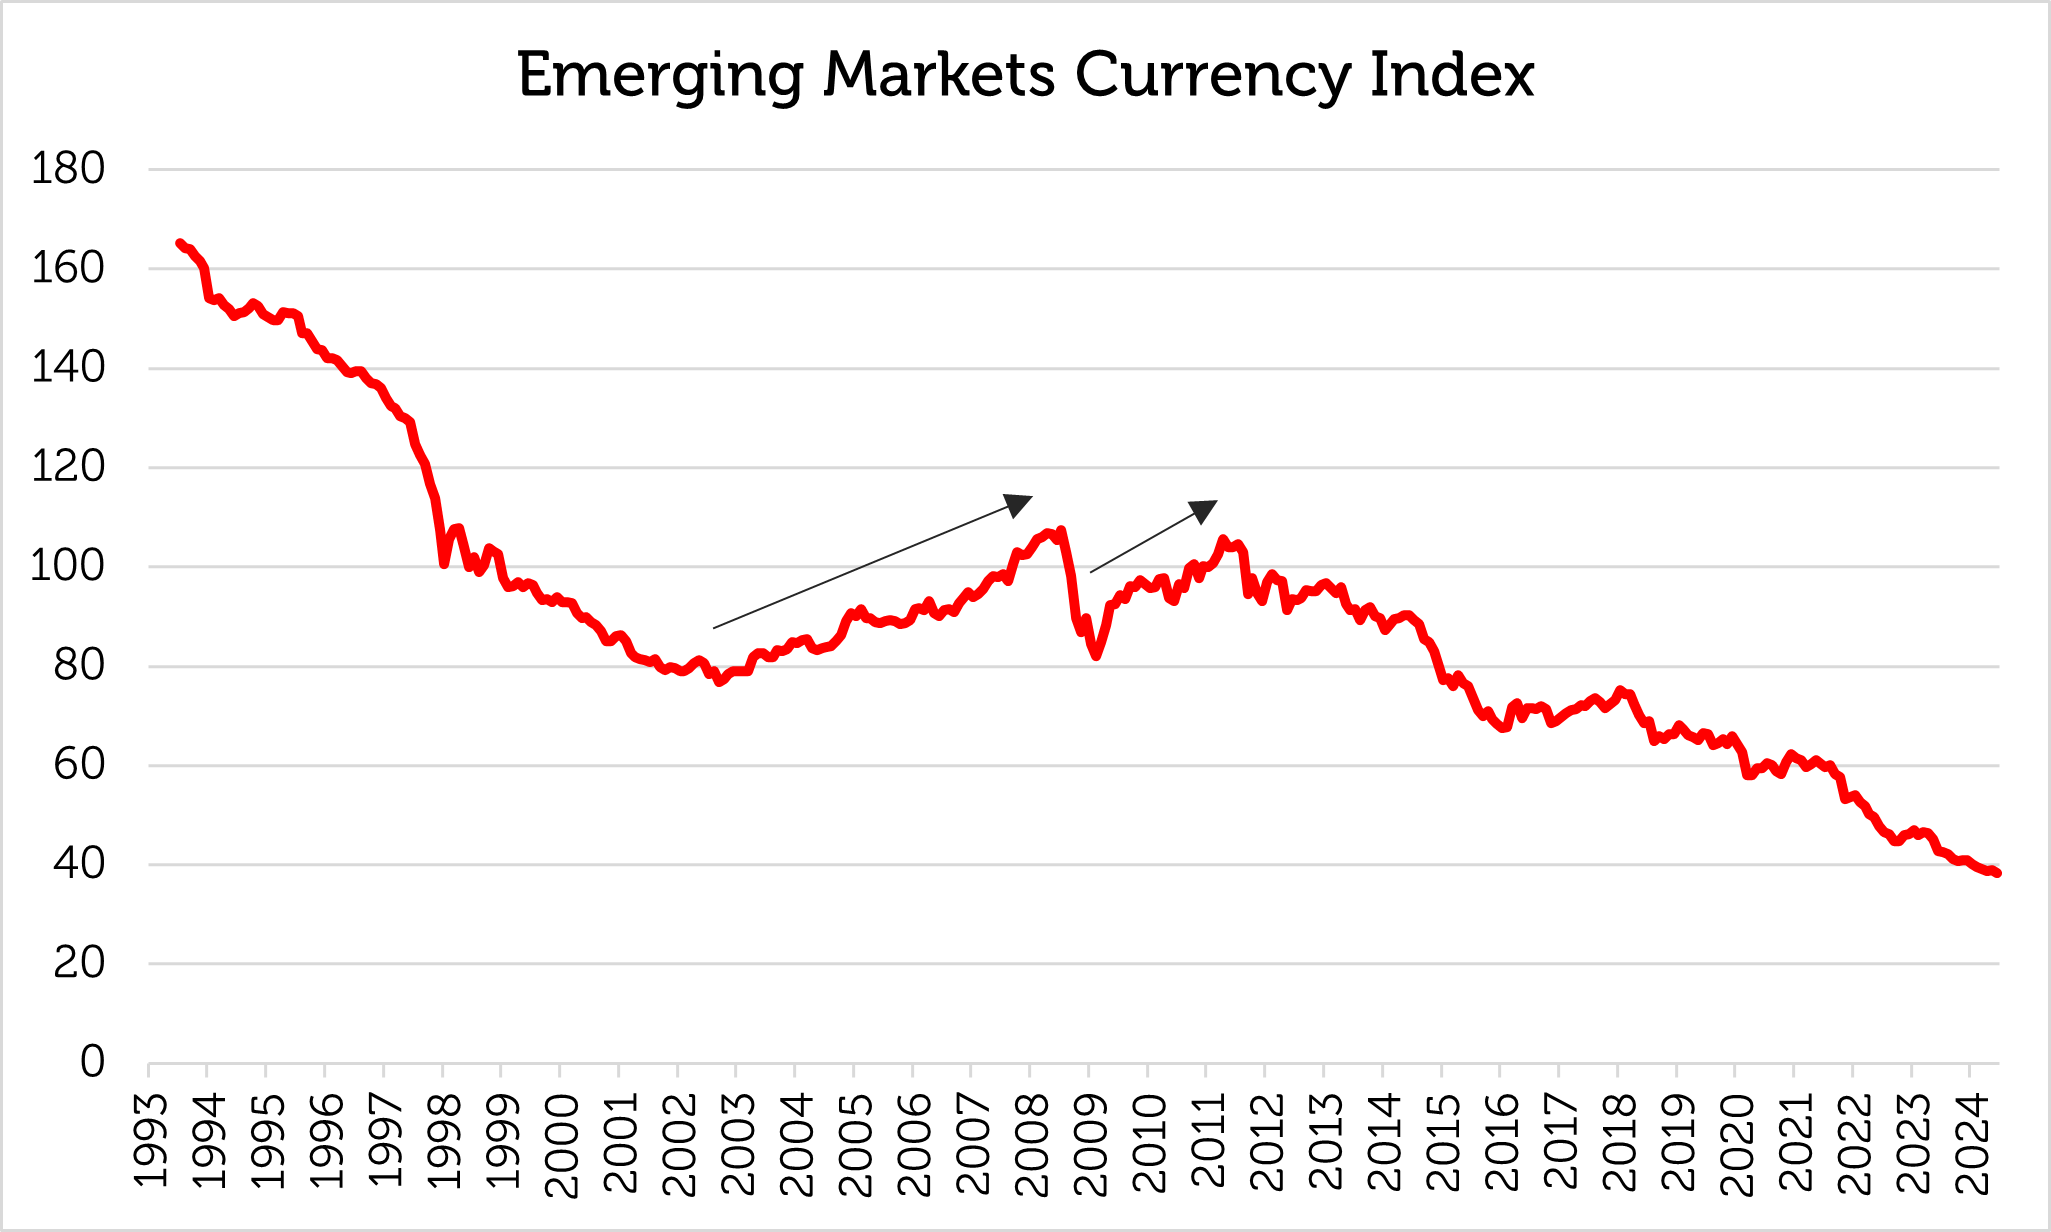
Source: Bloomberg as of 30 June 2024. The information shown above is for illustrative purposes. Past performance is not a guide to future results.

4. Emerging market performance comes in cycles

Although the MSCI Emerging Market Equity Index has underperformed the MSCI ACWI Equity Index in recent years, it has outperformed over the long run because of periods of powerful gains that have come in waves.
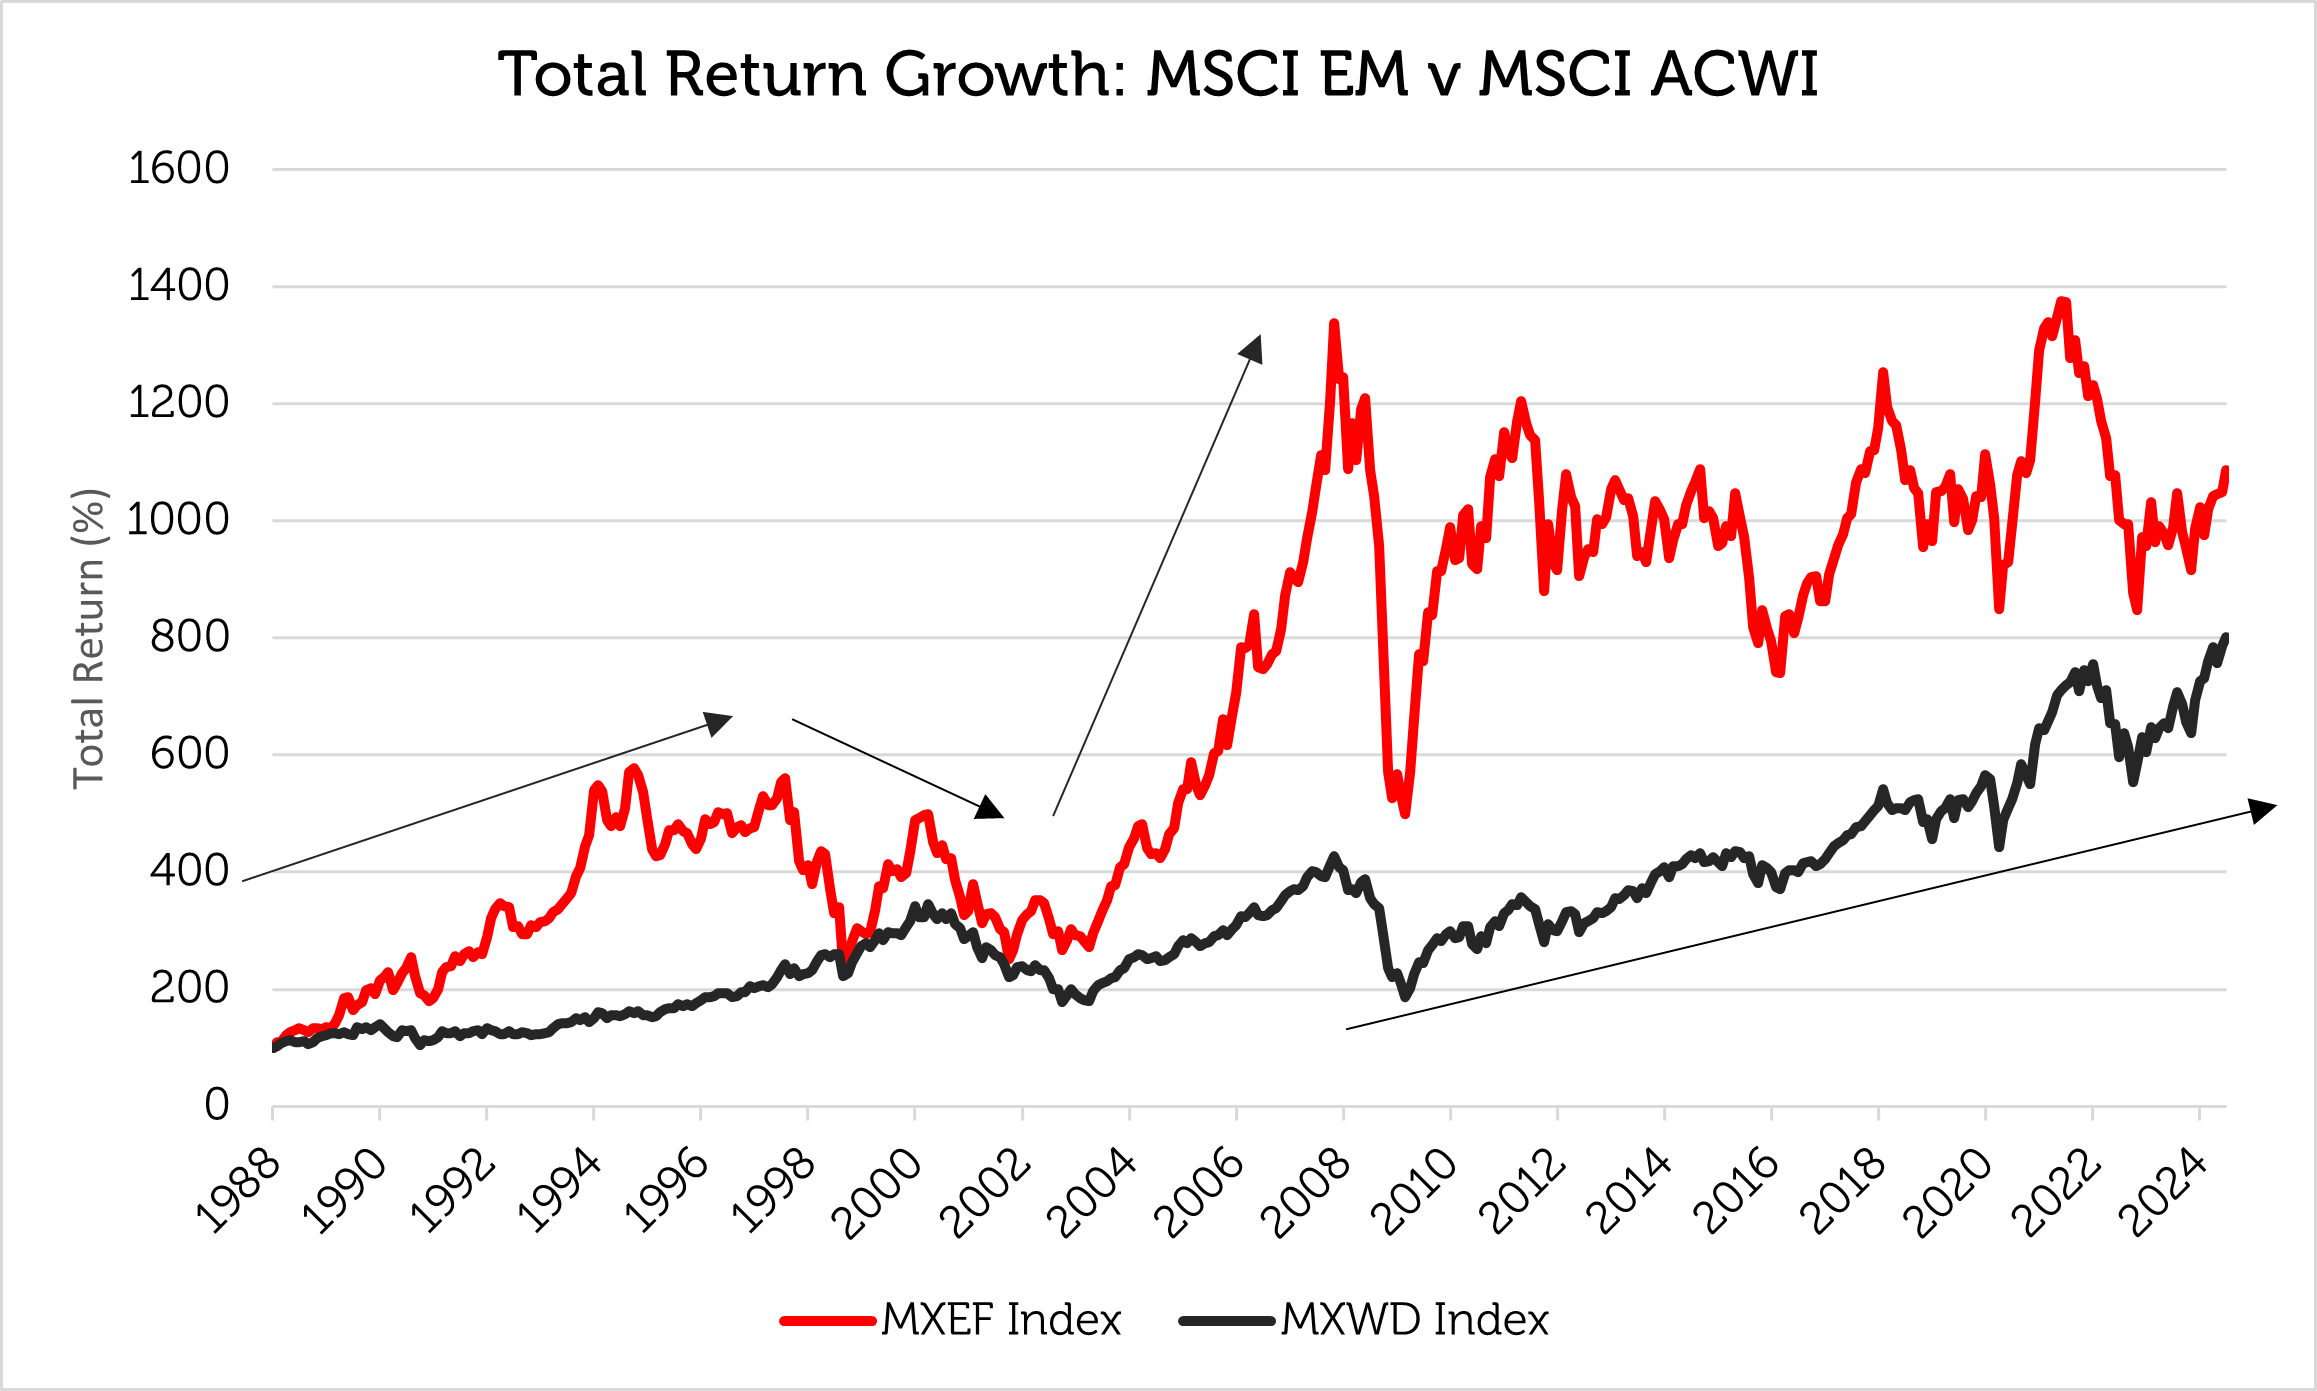
Source: Bloomberg as of 30 June 2024. The information shown above is for illustrative purposes. Past performance is not a guide to future results. Normalised to 100 %.

The MSCI Emerging Markets Index has outperformed the MSCI ACWI since inception. From inception on 12/31/1987, MSCI Emerging Markets has outperformed MSCI ACWI by 1% per annum, having delivered 8.8% total return a year compared to 7.8% for ACWI. We have broken down the relative performance of the two indices into four periods marked by the arrows on the chart above.

12/31/87 – 12/31/97: EM +19.7% p.a, ACWI +9.2% p.a.

The first wave was the launch of the emerging market asset class on 12/31/1987 until the onset of the Asian Financial Crisis in the second half of 1997. In that decade of optimism over a new asset class, emerging markets returned 19.7% per year, more than 10% ahead of ACWI at 9.2% per year.

12/31/97 – 12/31/02: EM -4.8% p.a., ACWI -1.8% p.a.

The emerging markets crises of the late 1990s happened at the same time as the US technology boom, which culminated in the global bear market known as the ‘tech wreck’ in the first years of the new millennium. Emerging markets underperformed during the five years from 12/31/1997 until 12/31/2002, losing 4.8% a year compared to ACWI’s more modest annual loss of 1.8% during this period.

12/31/02 – 12/31/07: EM +37.3% p.a., ACWI +18.9% p.a.

The end of the bear market ushered in the ‘super cycle’, a period of high global growth led by Chinese urbanization and industrialization that lasted until the Global Financial Crisis (GFC) in 2008. The ‘super cycle’ was the period of strongest absolute and relative emerging market performance. From 12/31/2002 until 12/31/2007, the MSCI Emerging Market Index gained 37.3% per annum, compared to the 18.9% annual gain of the MSCI ACWI Index.

12/31/08 – 06/30/24: EM +7.2% p.a., ACWI +11.2% p.a.

The years following the GFC have been the most disappointing for emerging markets investors on a relative basis, with an annualized return of 7.2% from 12/31/2008 in relation to the ACWI annual return of 11.2%, a performance gap of 4.0% per year. Investors have been frustrated by a long period of below average returns and an apparent lack of catalysts for emerging market outperformance.

5. A number of catalysts point to an emerging equity market recovery

Emerging market equities have tended to perform well when the yield curve has steepened and commodity prices have strengthened, both of which reflect reflation and higher nominal GDP growth. As interest rates have climbed since 2021, the US 10-year treasury bond yield has risen to its highest level since the mid-2000s. This indicates that the world has exited the disinflationary environment that prevailed from 2010 to 2020, suggesting impending recovery for the emerging market asset class.
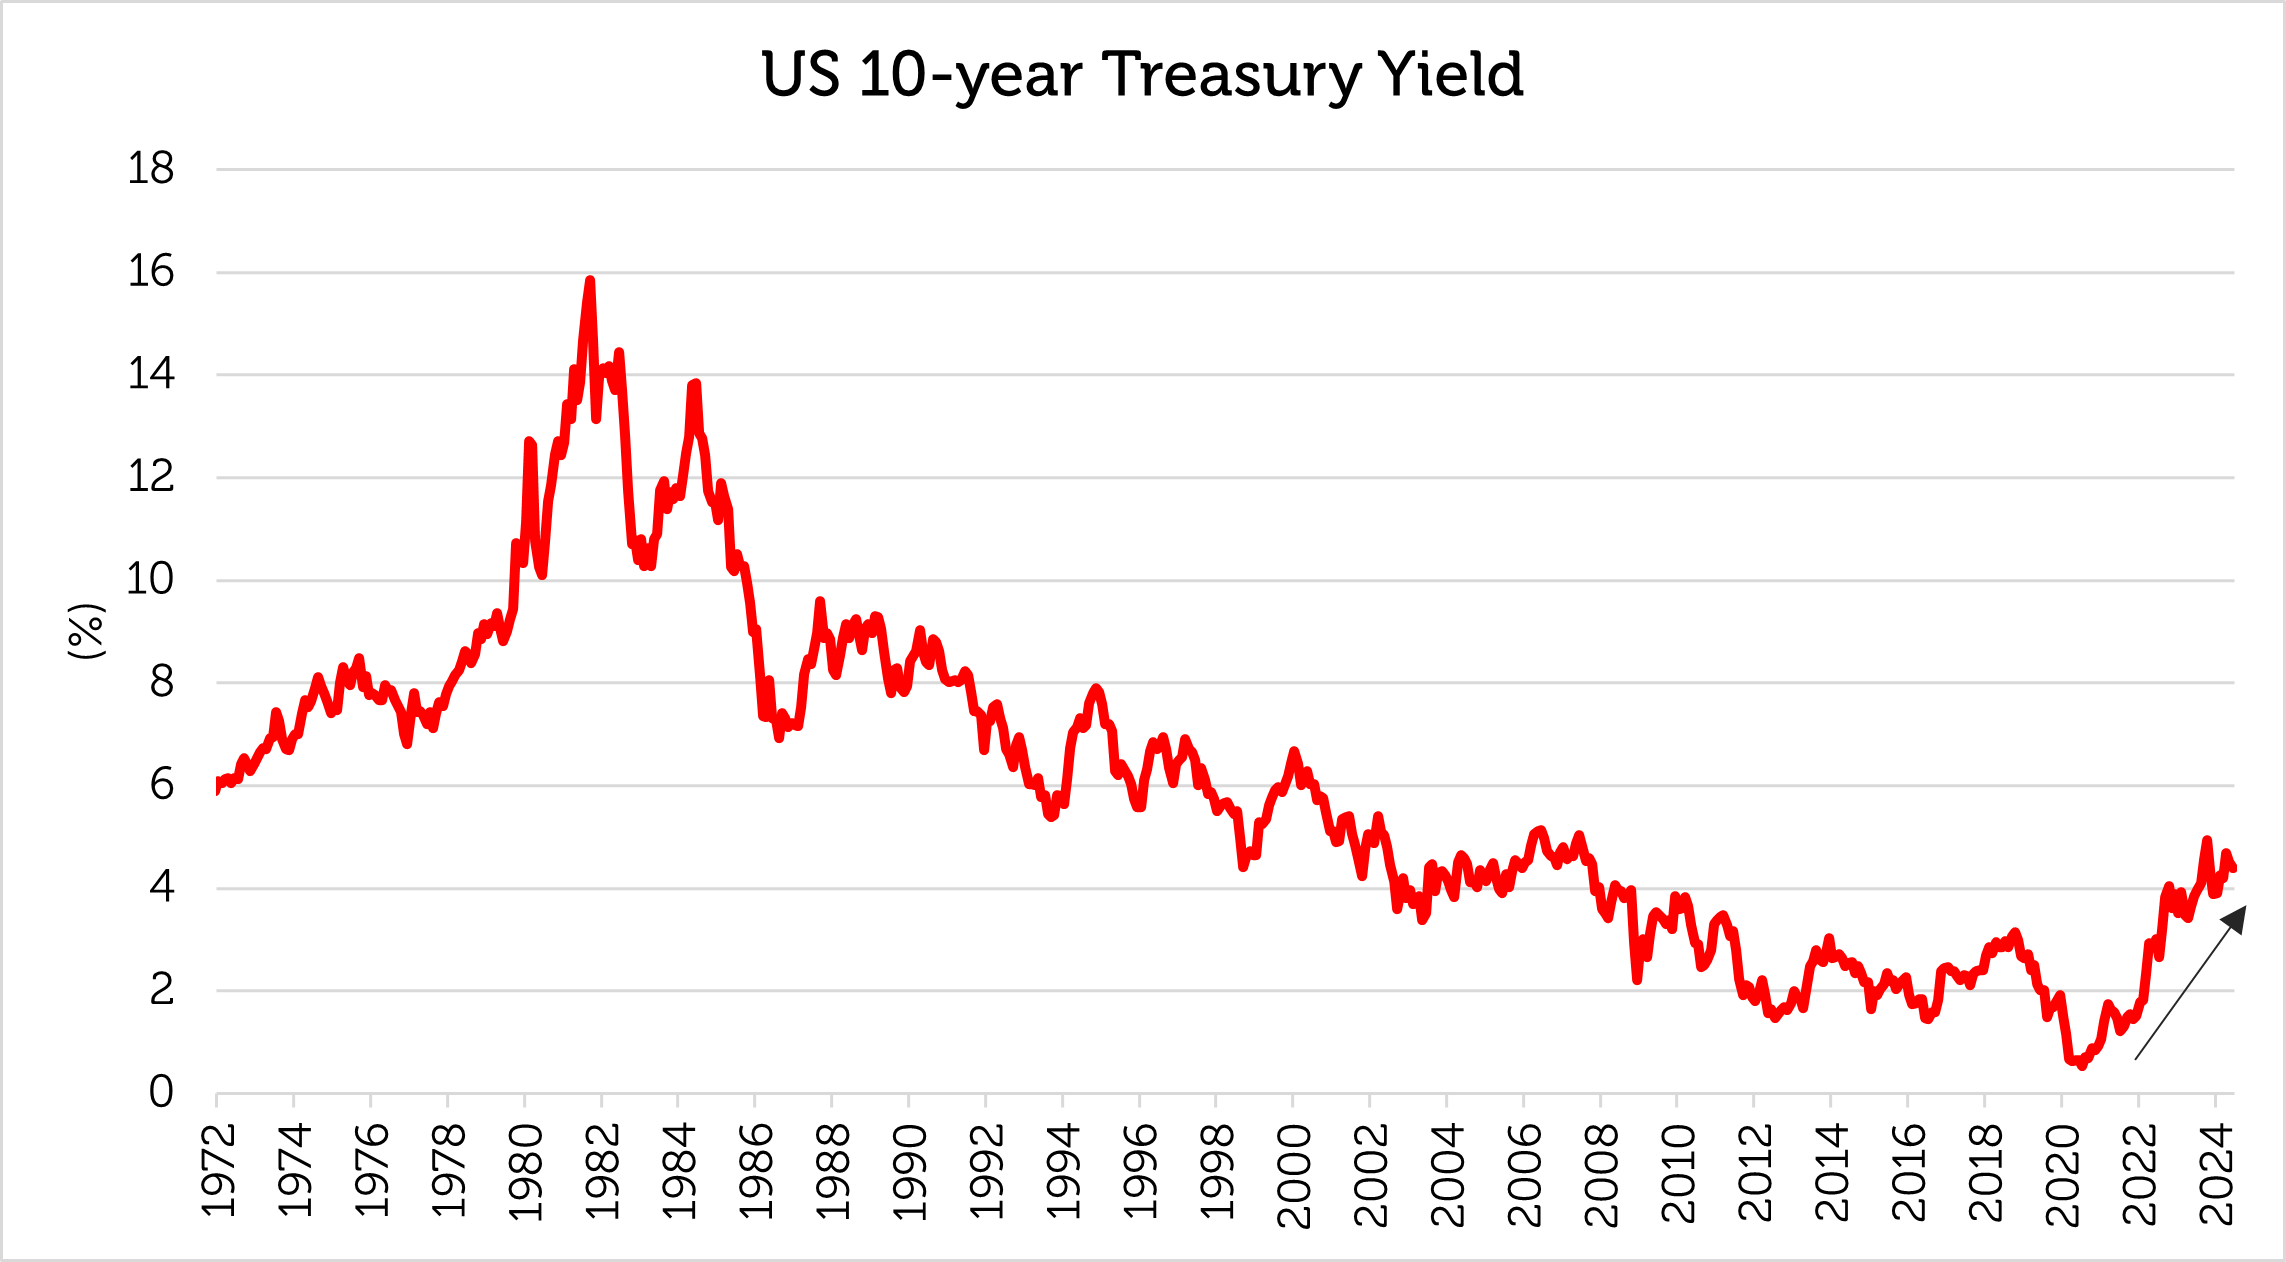
Source: Bloomberg as of 30 June 2024. The information shown above is for illustrative purposes. Past performance is not a guide to future results.

Commodities have begun to recover in tandem, especially industrial and precious metals such as copper and gold, among others. The Commodity Research Bureau (CRB) Index began to move up at about the same time as the US 10-year treasury yield but is still far below its highs of the mid-2000s.
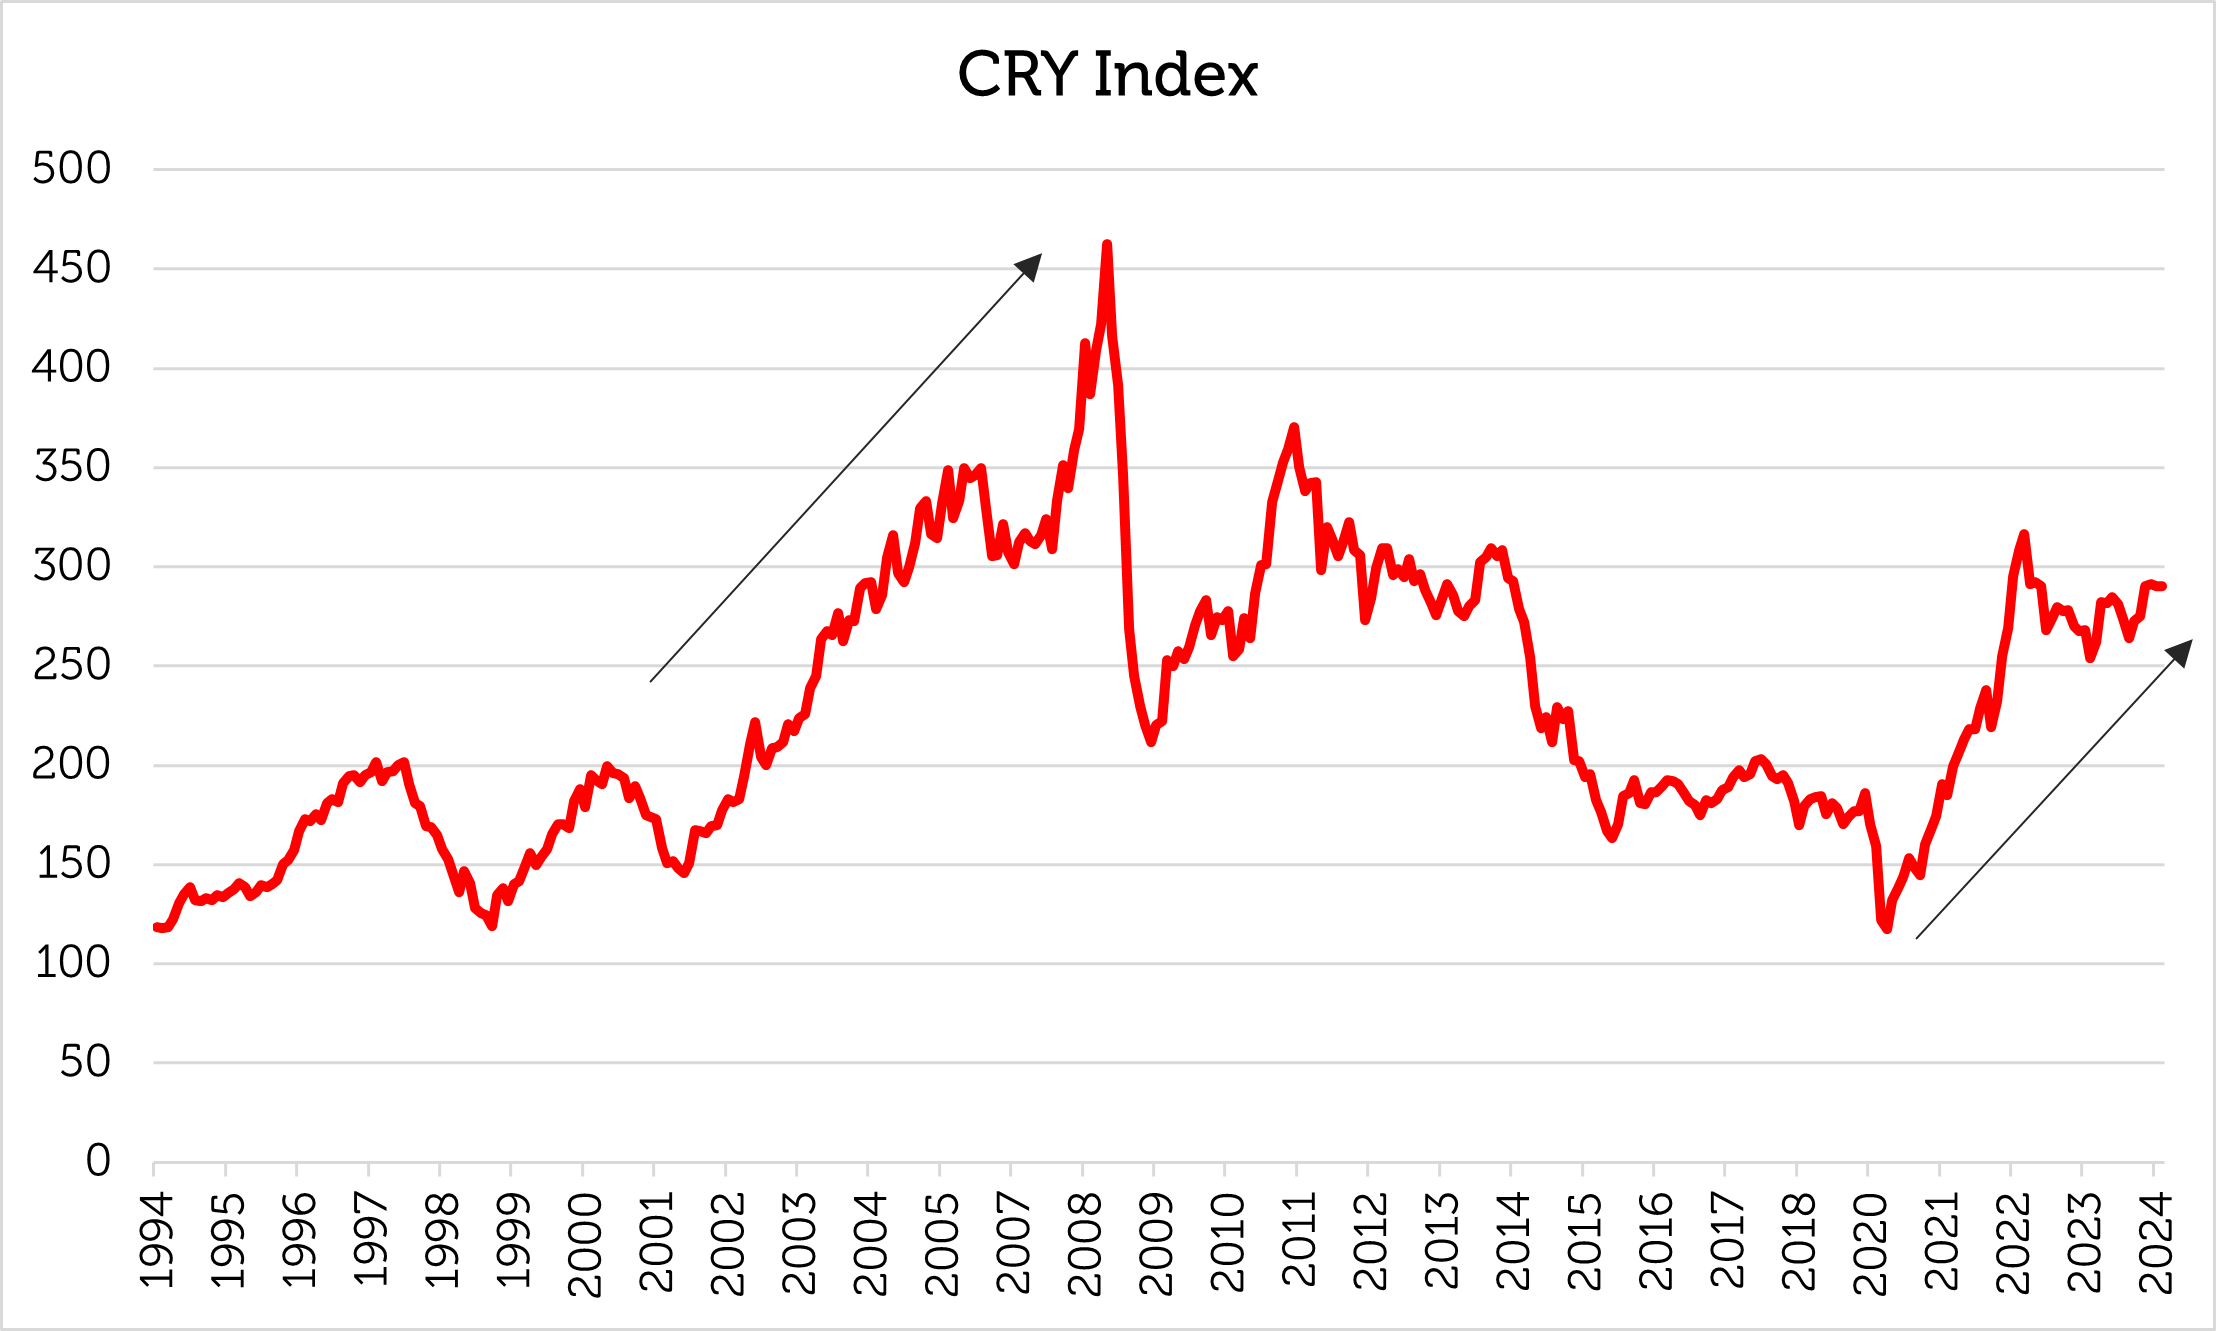
Source: Bloomberg as of 30 June 2024. CRY refers to the FTSE/CoreCommodity CRB Excess Return Index The information shown above is for illustrative purposes. Past performance is not a guide to future results.

Our analysis of the relationship between industrial and precious metals, the US 10-year treasury yield and the MSCI Emerging Markets Equity Index indicates that industrial metals are an important driver of returns, for which the signal has just turned positive – see the encircled part of the chart below.
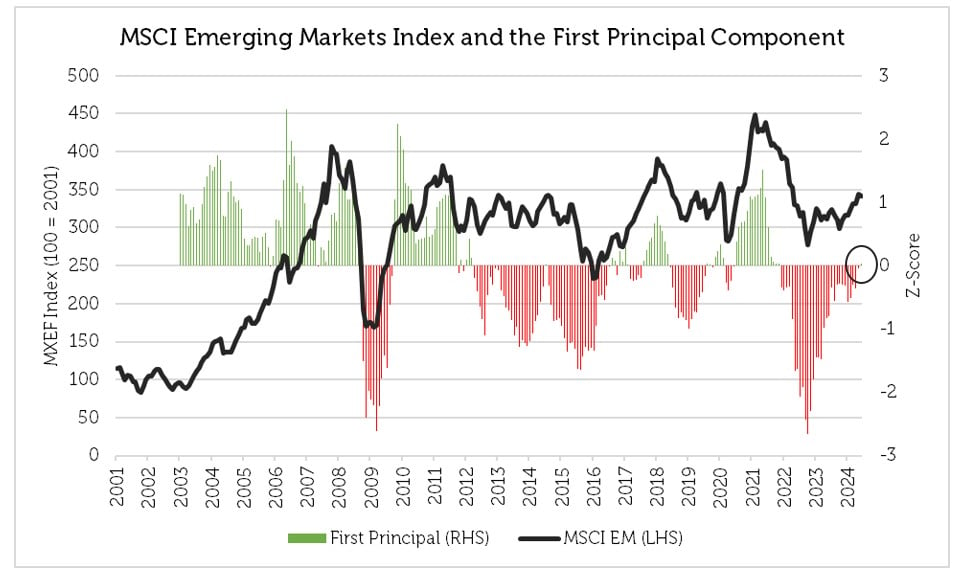
Source: Bloomberg, Redwheel as of 30 June 2024. First Principal is green when positive, red when negative. Principal component analysis (PCA) is a common technique for reducing the dimensionality of a set of variables. Our Emerging Market Fundamentals model is composed of five global variables. See appendix for details. The information shown above is for illustrative purposes. Past performance is not a guide to future results.

Furthermore, emerging markets tend to have a better sovereign debt profile than developed markets (see the section below), which should give investors greater confidence to invest in emerging markets as bond yields in developed markets rise.

6. Indebtedness is generally less burdensome for emerging than advanced economies

A crucial feature of the bear markets and financial crises of the past 30 years has been – at least until the COVID-19 pandemic – the path of lower interest rates. The belief that interest rates would remain permanently low caused complacency in the assumption of higher levels of debt. Advanced economies now have, in most cases, greater burdens of debt than most emerging economies – see the chart below.
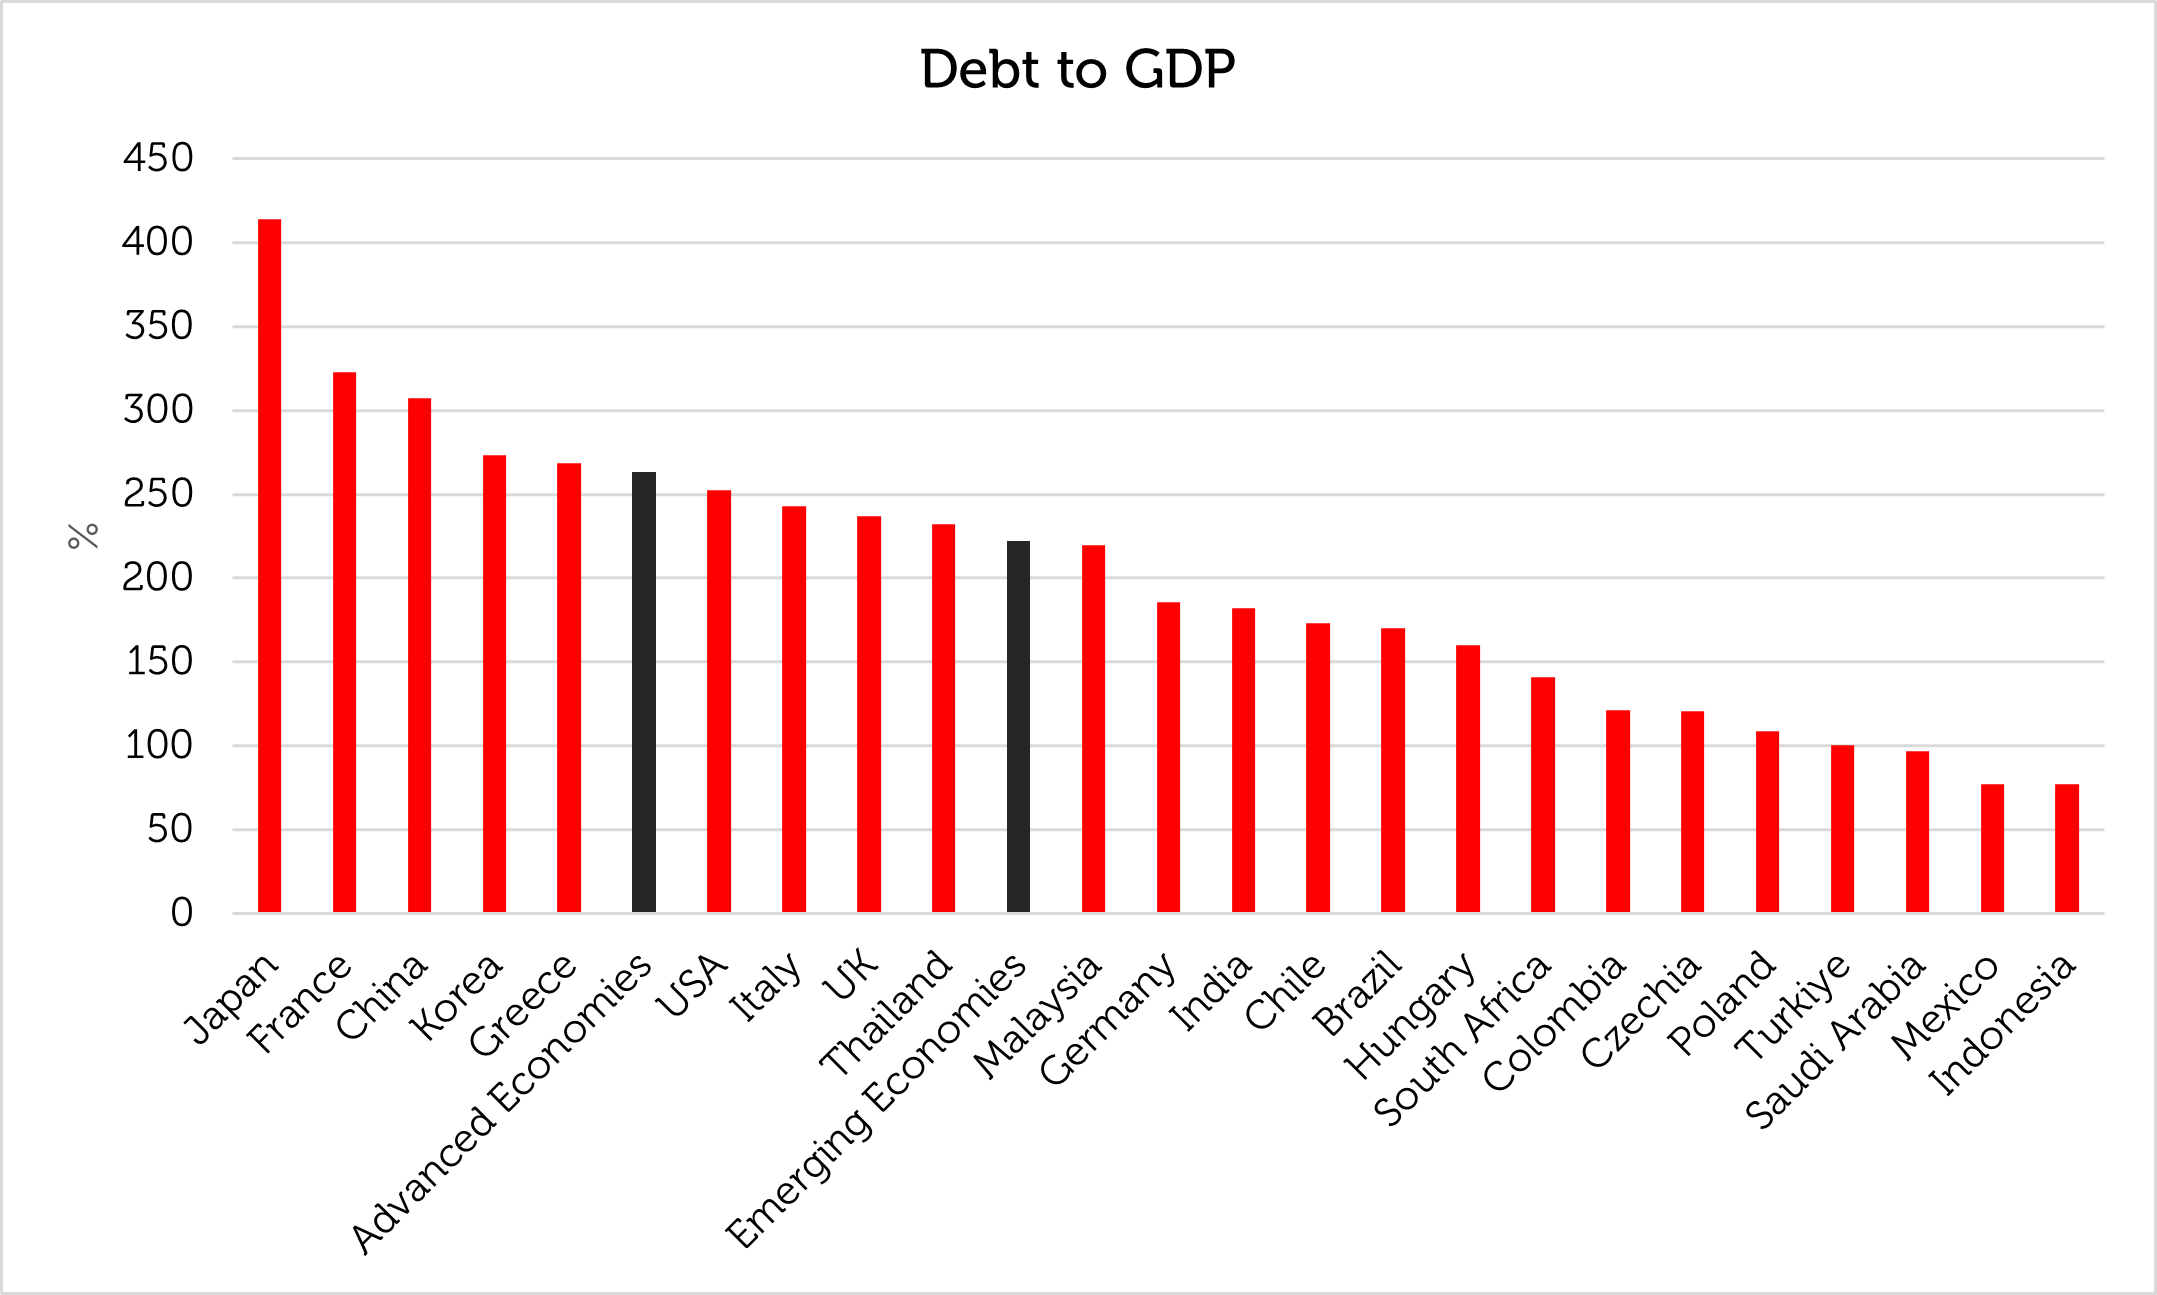
Source: Bank of International Settlements (BIS) as of 30 June, 2023. ‘Advanced Economies’ and ‘Emerging Economies’ show composite % debt to GDP for all countries within each universe as defined by the BIS. The information shown above is for illustrative purposes. Past performance is not a guide to future results.

The fiscal expansion that took place in response to the COVID-19 generated inflation and interest rates that are higher than any time since the mid-2000s [2]. Heavy indebtedness and higher interest rates tend to cause lower growth because cash is used for debt-servicing instead of investment. Furthermore, markets might start to worry about sovereign creditworthiness in developed markets, possibly leading to higher bond yields and lower valuations. Most Emerging markets already have higher bond yields and lower valuations than developed markets, so their more favourable debt profile might underpin relatively better performance as the deterioration in financial conditions is absorbed into richer bond and equity valuations in advanced economies.  

7. Emerging countries continue reforming…

Excessive debt has caused several financial crises since the inception of the asset class in the late 1980s. The Tequila Crisis in 1994 – 1995, as well as the Asian and Russian Crises in 1997 – 1998, resulted in financial assistance in exchange for the implementation of orthodox economic policies that spurred growth and boosted emerging market returns. Today, Egypt and Turkey[3] are both pursuing new economic policies designed to improve public finances and attract foreign capital. Elsewhere in the Middle East, Saudi Arabia has launched ‘Vision 2030’ to create a modern and vibrant society, a thriving economy that is less dependent upon oil, and an ambitious nation with global aspirations. Korea’s ‘Value-up’ programme is designed to enhance shareholder returns and close the persistent valuation discount to the rest of the emerging market universe. These initiatives should serve to boost emerging market equity performance. Argentina, which is currently classified as a stand-alone index within the MSCI universe, shows what can happen when investors become optimistic about the prospects for higher economic growth and a lower cost of capital that ought to result from proposed economic and financial reforms [4].
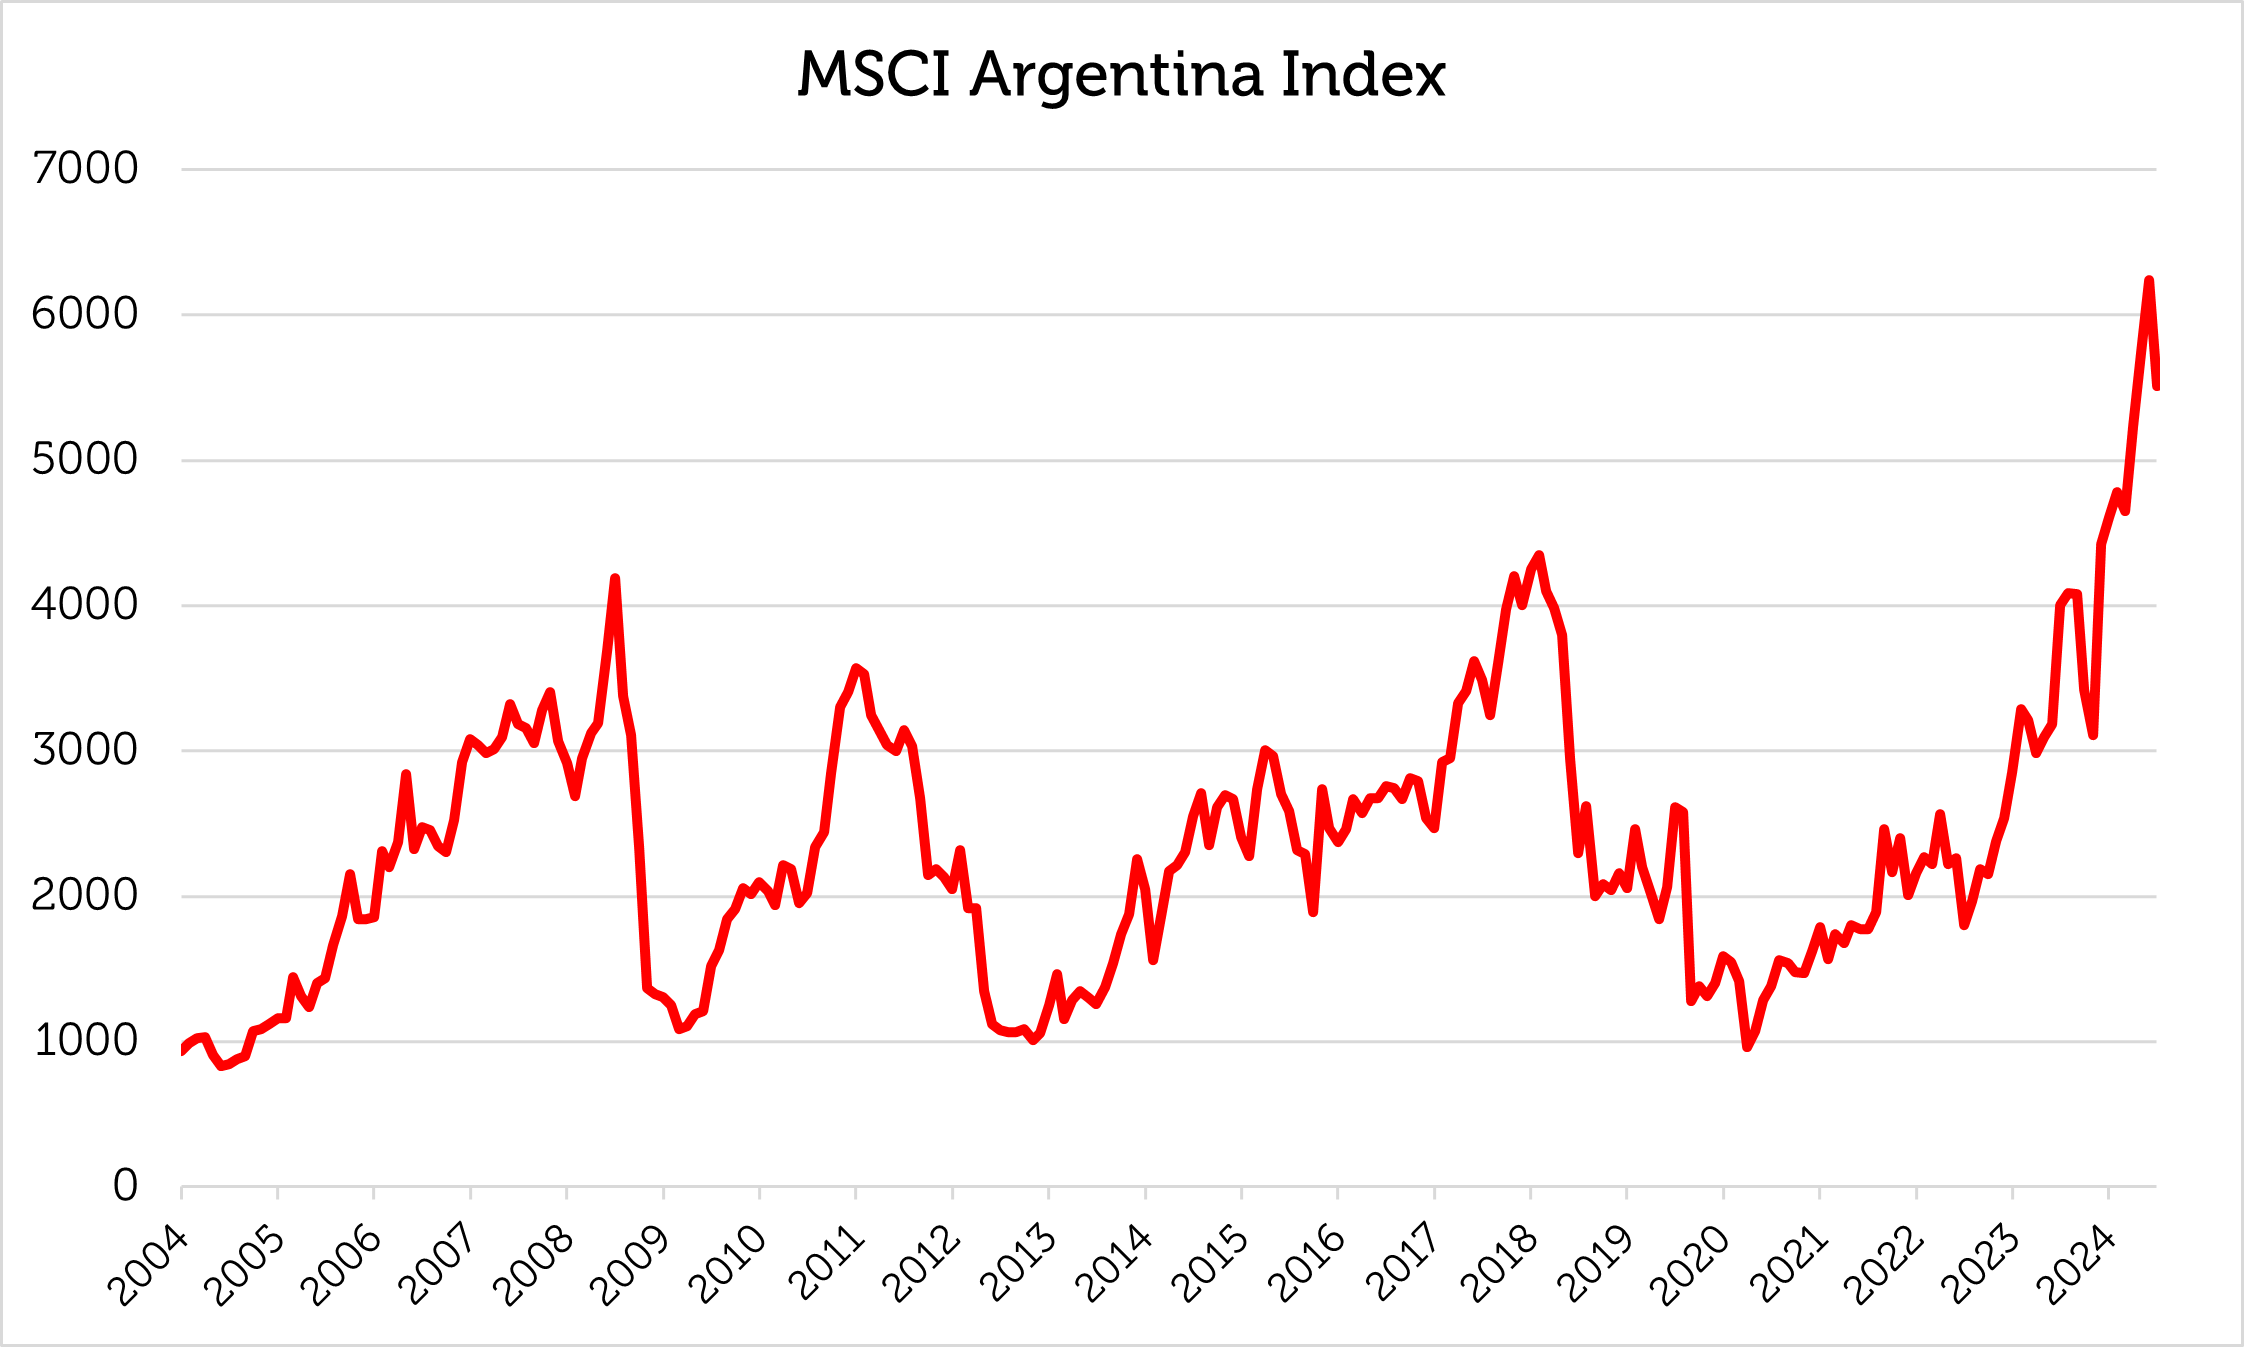
Source: Bloomberg as of 30 June 2024. The information shown above is for illustrative purposes. Past performance is not a guide to future results.

8. …but are under-owned

Although emerging equity markets have good fundamentals, cheap valuations and possible catalysts, long-term relative underperformance has caused many investors to eschew the asset class.
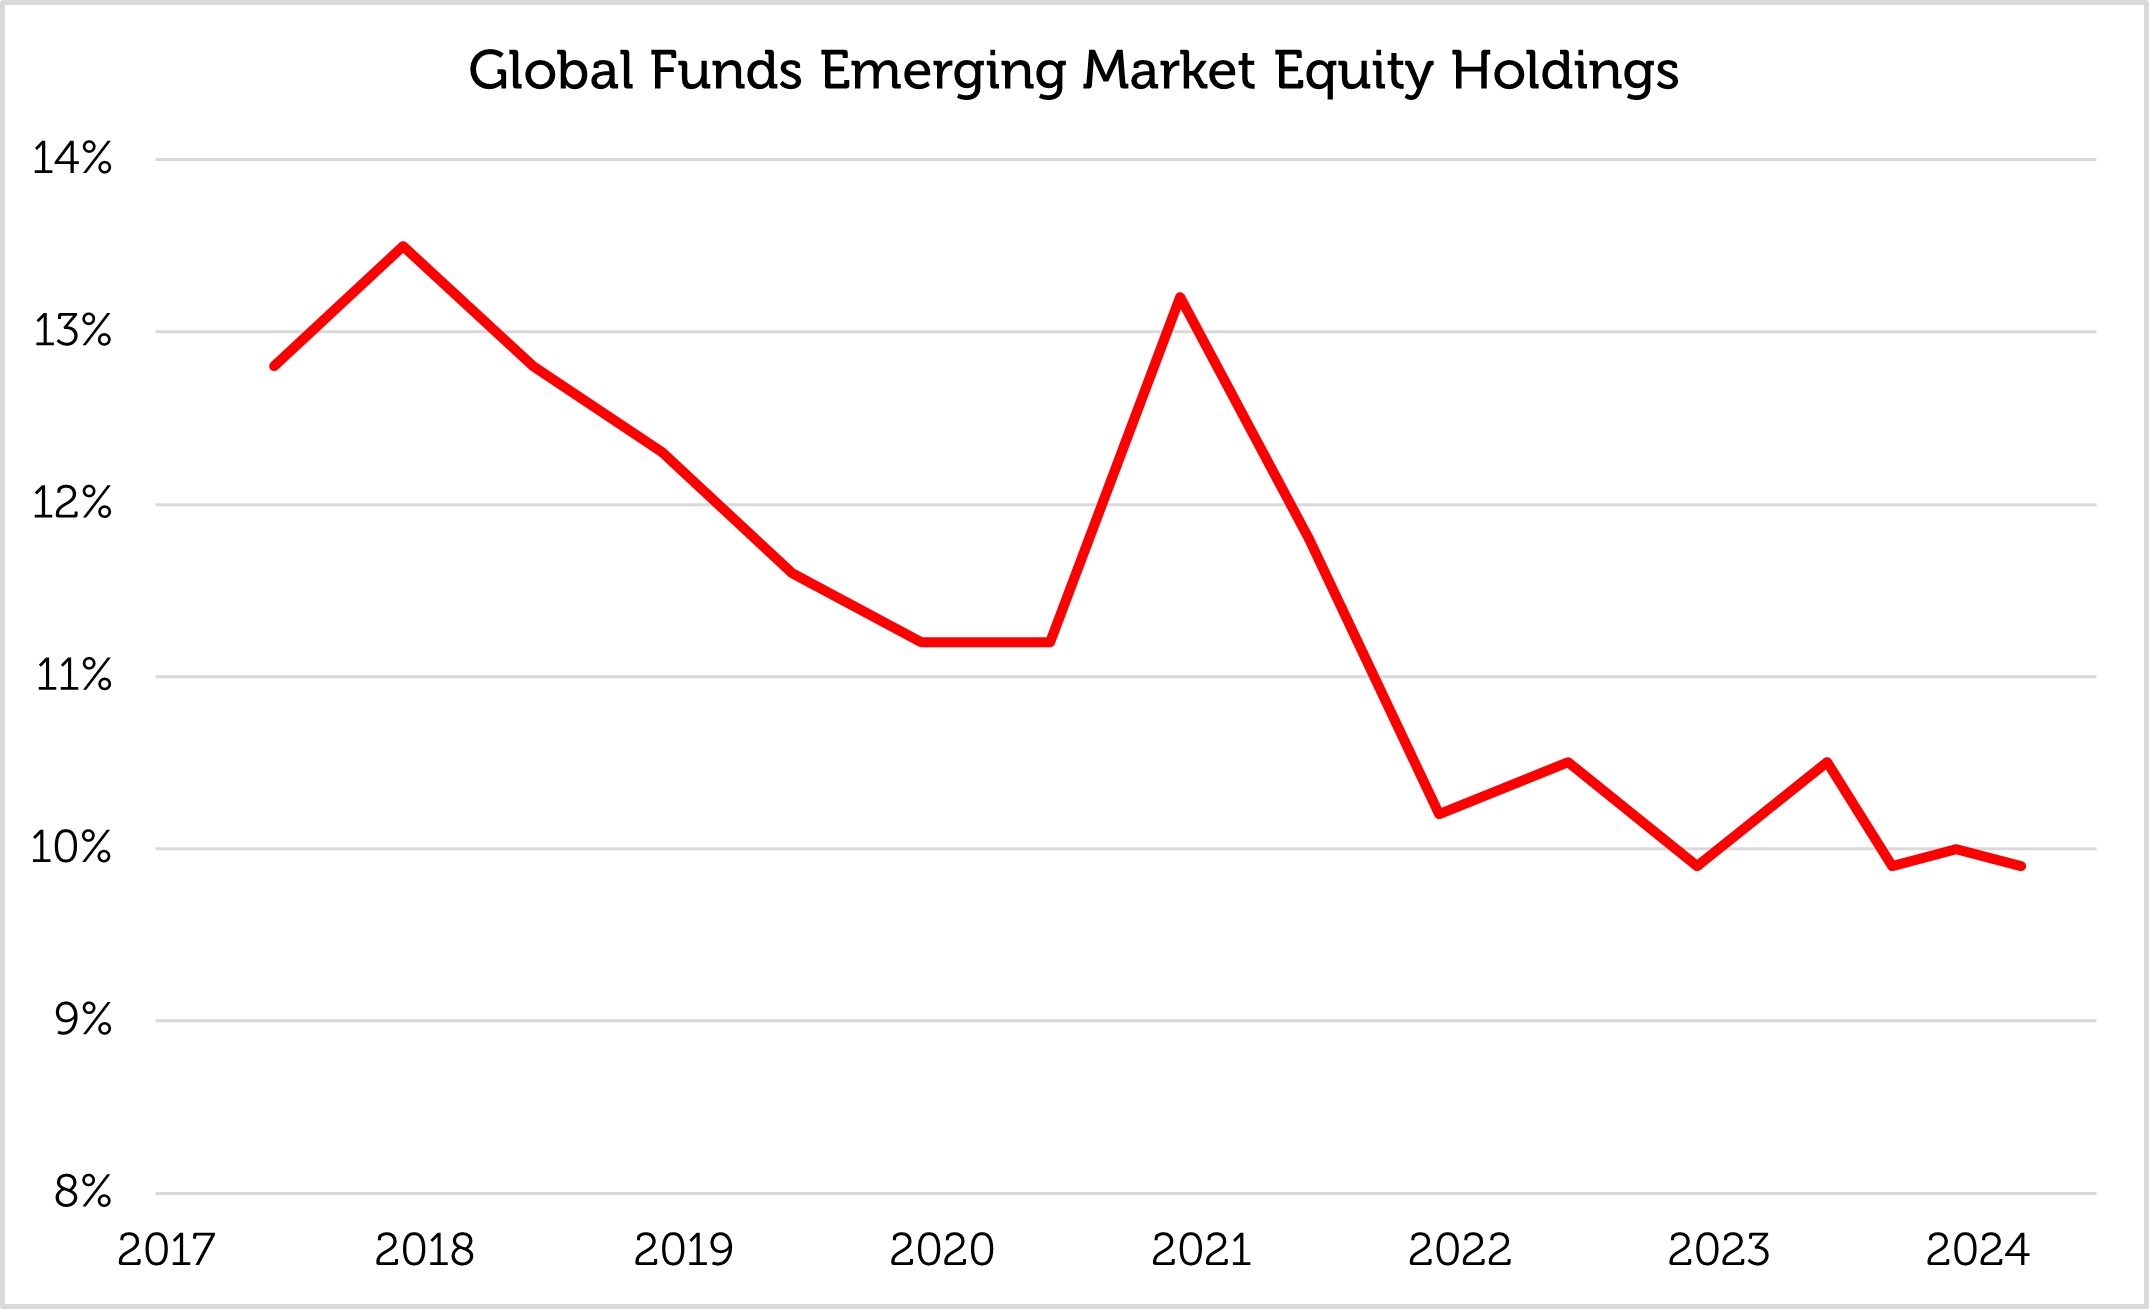
Source: UBS as of 31 March 2024. The information shown above is for illustrative purposes. Past performance is not a guide to future results.

Global equity investors have consistently reduced their exposure to EM, either through underperformance or reallocation to other asset classes. If EM were to outperform, inflows would probably follow to increase exposure to this under-owned asset class.

9. Emerging Markets are under-capitalized in relation to GDP

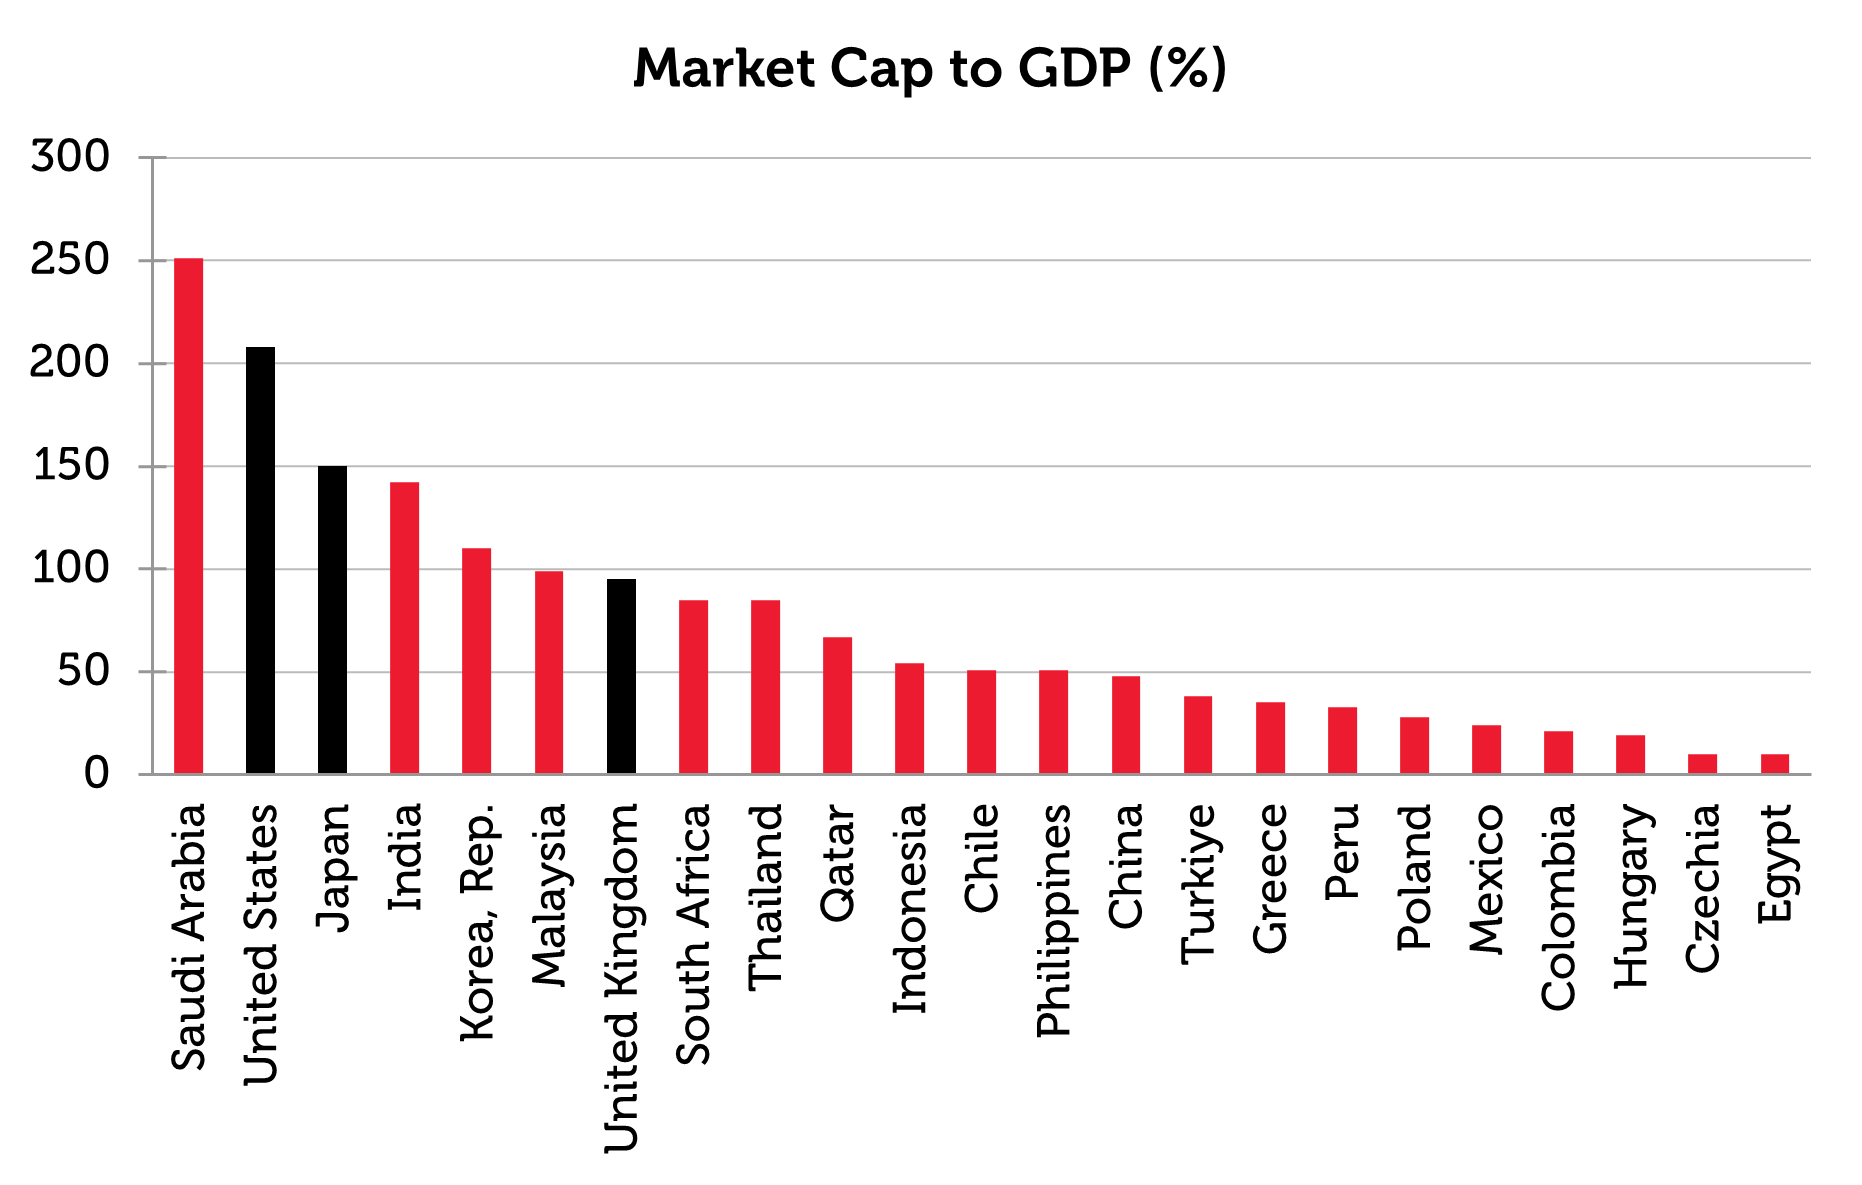
Emerging markets are both under-owned and under-capitalized. The ‘Buffett Indicator’, which is the ratio of total market capitalization to GDP, is meant to show that market capitalization of less than 100% of GDP represents relatively attractive value.
Source: World Bank and Bloomberg as of 30 June 2024. The information shown above is for illustrative purposes. Past performance is not a guide to future results.

Developed markets including the US, the UK and Japan are capitalized in excess of 100% of GDP. This suggests that their valuations are comparatively rich, or that large multinational corporations are likely to be headquartered and listed in developed countries. Except for Saudi Arabia, which is home to a global energy giant Aramco, most emerging markets are capitalized below 100% of GDP. The implication is that their valuations are relatively attractive, and that the equity growth potential is higher for emerging than for developed markets. Moreover, the under-capitalized markets tend to be the best diversifiers in a global portfolio.

10. EM is one of the best global diversifying equity allocations

Of the major regional MSCI indices, emerging markets remain a source of diversification and potential for alpha in efficient global equity portfolios because of the relatively low correlation to other regions – see the table below.

Source: Bloomberg as of 30 June. The information shown above is for illustrative purposes. Past performance is not a guide to future results.

The comparatively low correlations and valuations in emerging market equities mean that the asset class represents an efficient allocation on a risk / return basis, as shown by the efficient frontier.
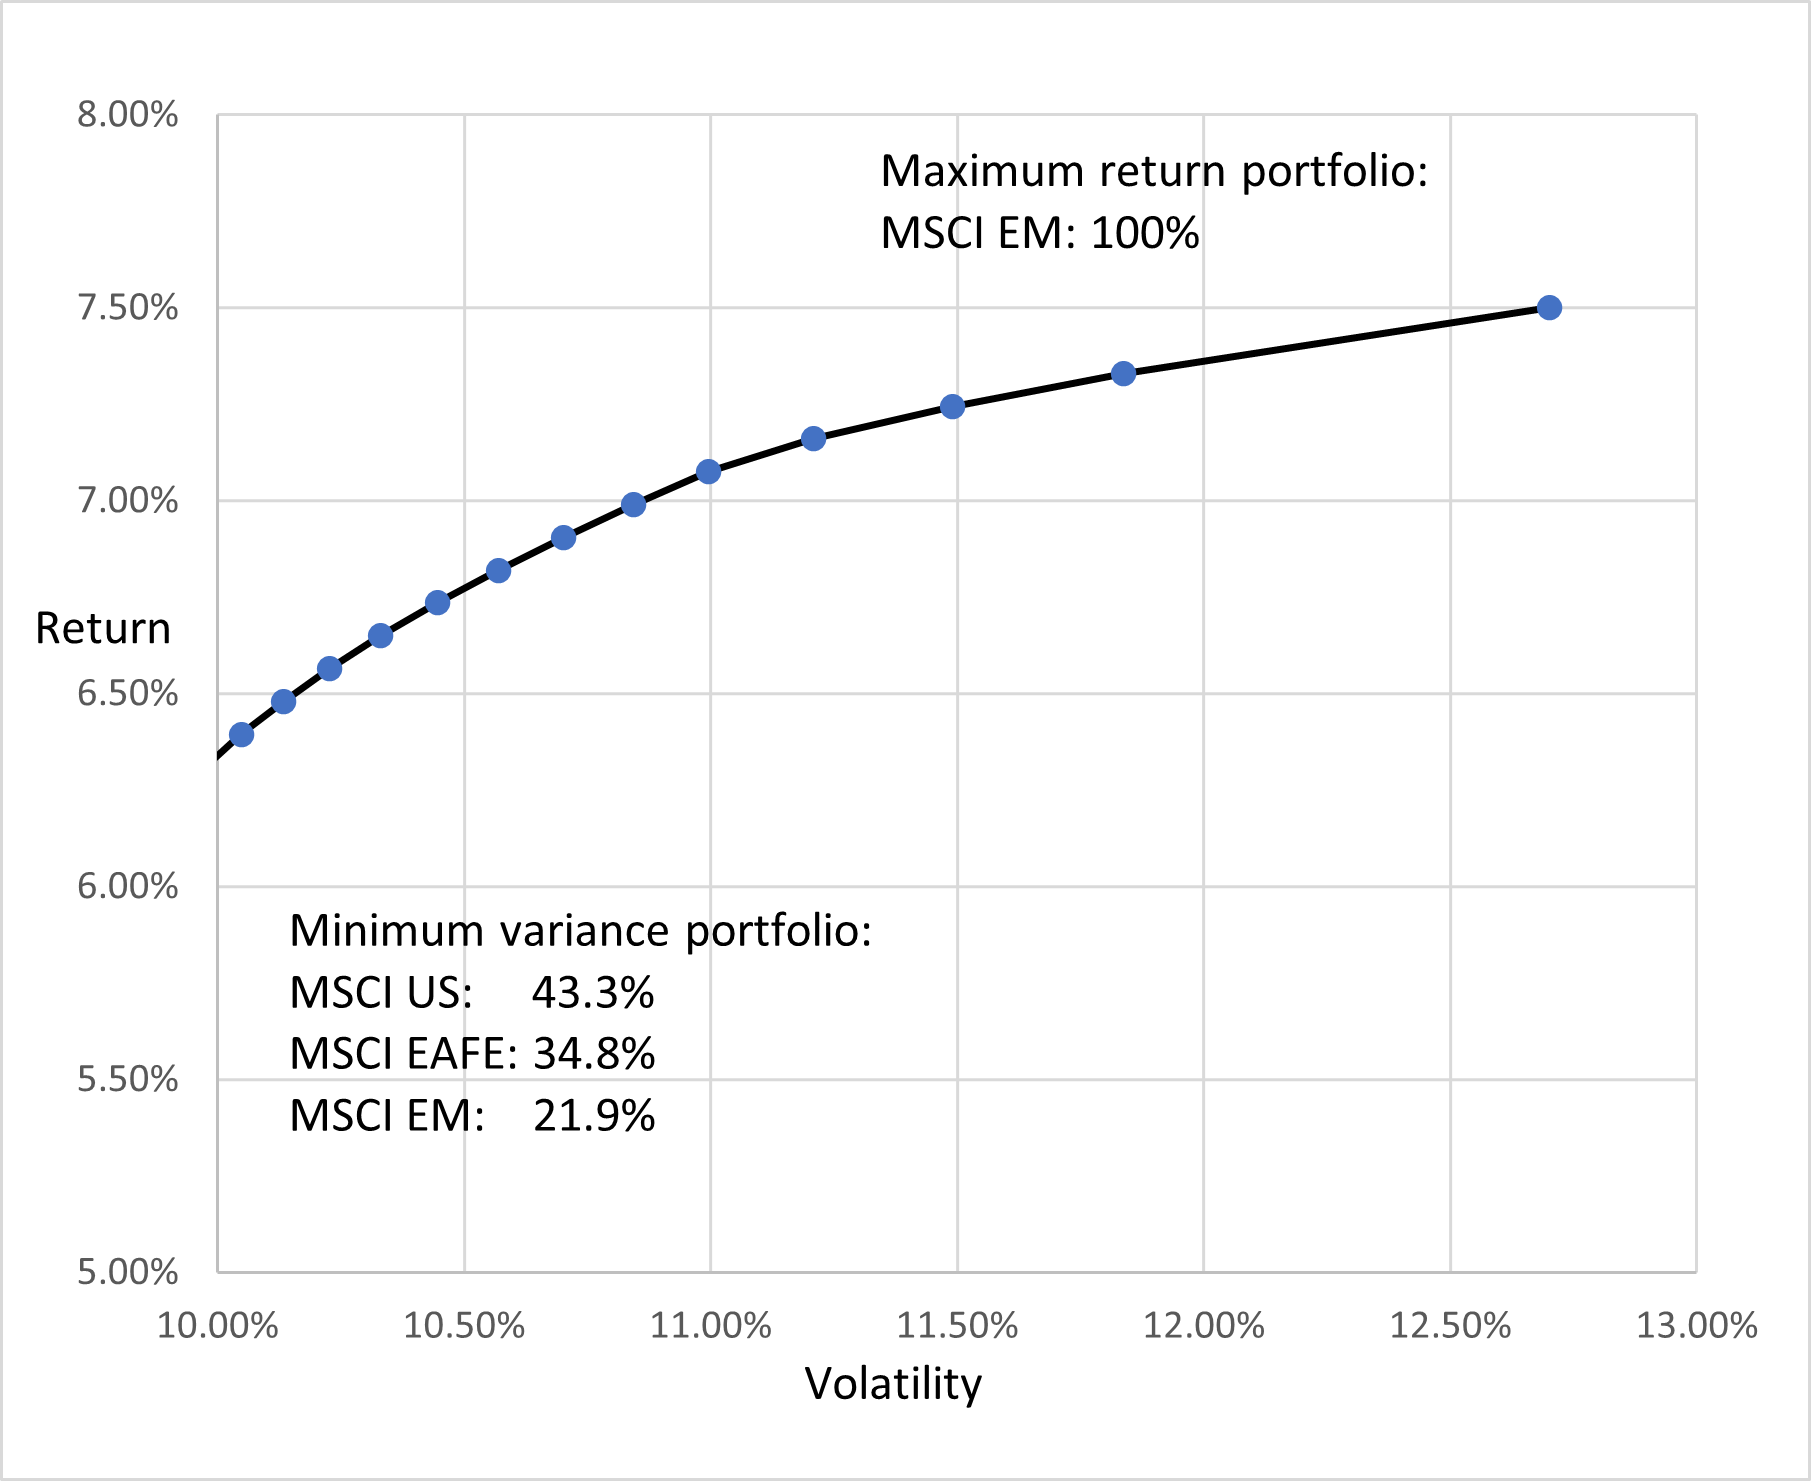
Source: Bloomberg, HSBC, 30 June 2024. The efficient frontier comprises possible combinations of MSCI EAFE, MSCI Emerging Markets and MSCI US equity indices that offer the highest expected return for a specific level of risk, showing the benefit of diversification. The information shown above is for illustrative purposes. Past performance is not a guide to future results.

A global equity portfolio includes an allocation to emerging markets even at the minimum variance level. Exposure to emerging markets is added in pursuit of higher returns to create the maximum return portfolio, which theoretically consists entirely of emerging markets equities.
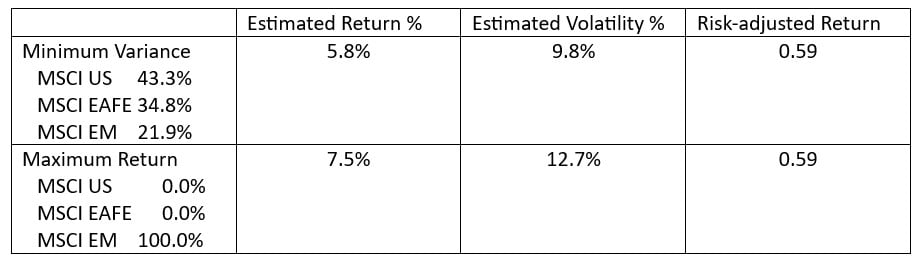
Source: HSBC, 30 June 2024. The information shown above is for illustrative purposes. Past performance is not a guide to future results. Risk-adjusted return is calculated as estimated return / estimated volatility.

Allocations to emerging markets are efficient in this example, with higher risk leading to better potential absolute and risk-adjusted returns.

Appendix: Principal component analysis methodology

Principal component analysis (PCA) is a common technique for reducing the dimensionality of a set of variables. The dimensionality reduction is performed by computing the directions (principal components: PC) that capture the highest amount of common variation.

By transforming the data into principal components, PCA enables a different visualization and analysis of the hidden patterns encoded in the data.

What are principal components?

In time-series, principal components are newly constructed variables through the linear combination of all the existing variables in the data set. The combination is unique and must satisfy two conditions:

  1. PCs are uncorrelated (orthogonal) among each other’s
  2. Information is maximized as it’s squeezed or packed into the first principal components.

We usually rank principal components in a decreasing manner, such that the first one encodes the highest amount of information.

Theoretically, we could build as many (independent) principal components as the dimensionality of the original data. PCA is performed such that we allocate the maximum amount of information as possible in the first component. Consequently, with the first PCs we are usually able to extract the key common directionality subject to the minimum amount of information lost.

Our EM Fundamentals model is composed of five global variables:

  • The price of copper (12-month % change)
  • The price of gold (12-month % change)
  • US 10-year yields (12-month change)
  • The USD expressed by the DXY index (12-monthm % change)
  • A global economic sentiment indicator described by the Sentix index

Sources:

[1] Bloomberg as of 30 June 2024

[2] Bloomberg as of 30 June 2024

[3] See ‘Policy U-turn in Turkey sets stage for economic and financial revival’ Redwheel, June 2024

[4] See ‘Frontier markets: from reform to recovery?’ Redwheel, June 2024

Key Information
No investment strategy or risk management technique can guarantee returns or eliminate risks in any market environment. Past performance is not a guide to future results. The prices of investments and income from them may fall as well as rise and an investor’s investment is subject to potential loss, in whole or in part. Forecasts and estimates are based upon subjective assumptions about circumstances and events that may not yet have taken place and may never do so. The statements and opinions expressed in this article are those of the author as of the date of publication, and do not necessarily represent the view of Redwheel. This article does not constitute investment advice and the information shown is for illustrative purposes only.

In case you missed it

Emerging and Frontier Markets
The ‘Fab 4’ become the ‘FOMO 3’

The Redwheel Emerging and Frontier Markets team explores the concentration challenge facing investors today and maps out under‑owned countries, sectors and themes that the team believes offer a richer blend of structural growth and genuine diversification.

27 July, 2026 | 01:48pm
UK Value & income
When it rhymes it pours

Shaul Rosten, Analyst with the Redwheel Value and Income team looks at the striking similarities between today’s market exuberance and the dotcom era, highlighting stretched valuations, record IPO activity and the dominance of the technology sector.

20 July, 2026 | 07:58pm
UK Value & income
Two beautiful games

As England’s World Cup campaign unfolds, the tournament provides a vivid reminder that sensible bets are grounded in probabilities. Supporters know that backing long-shot teams is unlikely to be rewarded, while favouring stronger sides with clear track records is more prudent. In his latest blog, Shaul Rosten of Redwheel's Value & Income team examines how value investing adopts a similar stance, focusing on quality businesses at attractive valuations, rather than richly priced growth narratives with low odds of delivery.

6 July, 2026 | 07:29pm

Disclaimer

Redwheel ® and Ecofin ® are registered trademarks of RWC Partners Limited (“RWC”). The term “Redwheel” may include any one or more Redwheel branded regulated entities including RWC Asset Management LLP, which is authorised and regulated by the UK Financial Conduct Authority and the US Securities and Exchange Commission (“SEC”); RWC Asset Advisors (US) LLC, which is registered with the SEC;  RWC Singapore (Pte) Limited, which is licensed as a Licensed Fund Management Company by the Monetary Authority of Singapore; Redwheel Australia Pty Ltd is an Australian Financial Services Licensee with the Australian Securities and Investment Commission; and Redwheel Europe Fondsmæglerselskab A/S which is regulated by the Danish Financial Supervisory Authority.

Redwheel may act as investment manager or adviser, or otherwise provide services, to more than one product pursuing a similar investment strategy or focus to the product detailed in this document. Redwheel and RWC (together “Redwheel Group”) seeks to minimise any conflicts of interest, and endeavours to act at all times in accordance with its legal and regulatory obligations as well as its own policies and codes of conduct.

This document is directed only at professional, institutional, wholesale or qualified investors. The services provided by Redwheel are available only to such persons. It is not intended for distribution to and should not be relied on by any person who would qualify as a retail or individual investor in any jurisdiction or for distribution to, or use by, any person or entity in any jurisdiction where such distribution or use would be contrary to local law or regulation.

This document has been prepared for general information purposes only and has not been delivered for registration in any jurisdiction nor has its content been reviewed or approved by any regulatory authority in any jurisdiction.

The information contained herein does not constitute: (i) a binding legal agreement; (ii) legal, regulatory, tax, accounting or other advice; (iii) an offer, recommendation or solicitation to buy or sell shares in any fund, security, commodity, financial instrument or derivative linked to, or otherwise included in a portfolio managed or advised by Redwheel; or (iv) an offer to enter into any other transaction whatsoever (each a “Transaction”). Redwheel Group bears no responsibility for your investment research and/or investment decisions and you should consult your own lawyer, accountant, tax adviser or other professional adviser before entering into any Transaction. No representations and/or warranties are made that the information contained herein is either up to date and/or accurate and is not intended to be used or relied upon by any counterparty, investor or any other third party.

Redwheel Group uses information from third party vendors, such as statistical and other data, that it believes to be reliable. However, the accuracy of this data, which may be used to calculate results or otherwise compile data that finds its way over time into Redwheel Group research data stored on its systems, is not guaranteed. If such information is not accurate, some of the conclusions reached or statements made may be adversely affected. Any opinion expressed herein, which may be subjective in nature, may not be shared by all directors, officers, employees, or representatives of Group and may be subject to change without notice. Redwheel Group is not liable for any decisions made or actions or inactions taken by you or others based on the contents of this document and neither Redwheel Group nor any of its directors, officers, employees, or representatives (including affiliates) accepts any liability whatsoever for any errors and/or omissions or for any direct, indirect, special, incidental, or consequential loss, damages, or expenses of any kind howsoever arising from the use of, or reliance on, any information contained herein.

Information contained in this document should not be viewed as indicative of future results. Past performance of any Transaction is not indicative of future results. The value of investments can go down as well as up. Certain assumptions and forward looking statements may have been made either for modelling purposes, to simplify the presentation and/or calculation of any projections or estimates contained herein and Redwheel Group does not represent that that any such assumptions or statements will reflect actual future events or that all assumptions have been considered or stated. There can be no assurance that estimated returns or projections will be realised or that actual returns or performance results will not materially differ from those estimated herein. Some of the information contained in this document may be aggregated data of Transactions executed by Redwheel that has been compiled so as not to identify the underlying Transactions of any particular customer.

No representations or warranties of any kind are intended or should be inferred with respect to the economic return from, or the tax consequences of, an investment in a Redwheel-managed fund.

This document expresses no views as to the suitability or appropriateness of the fund or any other investments described herein to the individual circumstances of any recipient.

The information transmitted is intended only for the person or entity to which it has been given and may contain confidential and/or privileged material. In accepting receipt of the information transmitted you agree that you and/or your affiliates, partners, directors, officers and employees, as applicable, will keep all information strictly confidential. Any review, retransmission, dissemination or other use of, or taking of any action in reliance upon, this information is prohibited. Any distribution or reproduction of this document is not authorised and is prohibited without the express written consent of Redwheel Group.

Funds managed by Redwheel are not, and will not be, registered under the Securities Act of 1933 (the “Securities Act”) and are not available for purchase by US persons (as defined in Regulation S under the Securities Act) except to persons who are “qualified purchasers” (as defined in the Investment Company Act of 1940) and “accredited investors” (as defined in Rule 501(a) under the Securities Act).

This document does not constitute an offer to sell, purchase, subscribe for or otherwise invest in units or shares of any fund managed by Redwheel. Any offering is made only pursuant to the relevant offering document and the relevant subscription application. Prospective investors should review the offering memorandum in its entirety, including the risk factors in the offering memorandum, before making a decision to invest.

AIFMD and Distribution in the European Economic Area (“EEA”)

The Alternative Fund Managers Directive (Directive 2011/61/EU) (“AIFMD”) is a regulatory regime which came into full effect in the EEA on 22 July 2014. RWC Asset Management LLP is an Alternative Investment Fund Manager (an “AIFM”) to certain funds managed by it (each an “AIF”). The AIFM is required to make available to investors certain prescribed information prior to their investment in an AIF. The majority of the prescribed information is contained in the latest Offering Document of the AIF. The remainder of the prescribed information is contained in the relevant AIF’s annual report and accounts. All of the information is provided in accordance with the AIFMD.

In relation to each member state of the EEA (each a “Member State”), this document may only be distributed and shares in a Redwheel fund (“Shares”) may only be offered and placed to the extent that (a) the relevant Redwheel fund is permitted to be marketed to professional investors in accordance with the AIFMD (as implemented into the local law/regulation of the relevant Member State); or (b) this document may otherwise be lawfully distributed and the Shares may lawfully be offered or placed in that Member State (including at the initiative of the investor).

Information Required for Offering in Switzerland of Foreign Collective Investment Schemes to Qualified Investors within the meaning of Article 10 CISA.

This is an advertising document.

The representative and paying agent of the Redwheel-managed funds in Switzerland (the “Representative in Switzerland”) FIRST INDEPENDENT FUND SERVICES LTD, Feldeggstrasse 12, CH-8008 Zurich. Swiss Paying Agent: Helvetische Bank AG, Seefeldstrasse 215, CH-8008 Zurich. In respect of the units of the Redwheel-managed funds offered in Switzerland, the place of performance is at the registered office of the Swiss Representative. The place of jurisdiction is at the registered office of the Swiss Representative or at the registered office or place of residence of the investor.

No investment strategy or risk management technique can guarantee returns or eliminate risks in any market environment.The term “RWC” may include any one or more RWC branded entities including RWC Partners Limited and RWC Asset Management LLP, each of which is authorised and regulated by the UK Financial Conduct Authority and, in the case of RWC Asset Management LLP, the US Securities and Exchange Commission; RWC Asset Advisors (US) LLC, which is registered with the US Securities and Exchange Commission; and RWC Singapore (Pte) Limited, which is licensed as a Licensed Fund Management Company by the Monetary Authority of Singapore.RWC may act as investment manager or adviser, or otherwise provide services, to more than one product pursuing a similar investment strategy or focus to the product detailed in this audio. RWC seeks to minimise any conflicts of interest, and endeavours to act at all times in accordance with its legal and regulatory obligations as well as its own policies and codes of conduct.This audio is directed only at professional, institutional, wholesale or qualified investors. The services provided by RWC are available only to such persons. It is not intended for distribution to and should not be relied on by any person who would qualify as a retail or individual investor in any jurisdiction or for distribution to, or use by, any person or entity in any jurisdiction where such distribution or use would be contrary to local law or regulation.This audio has been prepared for general information purposes only and has not been delivered for registration in any jurisdiction nor has its content been reviewed or approved by any regulatory authority in any jurisdiction. The information contained herein does not constitute: (i) a binding legal agreement; (ii) legal, regulatory, tax, accounting or other advice; (iii) an offer, recommendation or solicitation to buy or sell shares in any fund, security, commodity, financial instrument or derivative linked to, or otherwise included in a portfolio managed or advised by RWC; or(iv) an offer to enter into any other transaction whatsoever (each a “Transaction”). No representations and/or warranties are made that the information contained herein is either up to date and/or accurate and is not intended to be used or relied upon by any counterparty, investor or any other third party.RWC uses information from third party vendors, such as statistical and other data, that it believes to be reliable. However, the accuracy of this data, which may be used to calculate results or otherwise compile data that finds its way over time into RWC research data stored on its systems, is not guaranteed. If such information is not accurate, some of the conclusions reached or statements made may be adversely affected. RWC bears no responsibility for your investment research and/or investment decisions and you should consult your own lawyer, accountant, tax adviser or other professional adviser before entering into any Transaction. Any opinion expressed herein, which may be subjective in nature, may not be shared by all directors, officers, employees, or representatives of RWC and may be subject to change without notice. RWC is not liable for any decisions made or actions or in actions taken by you or others based on the contents of this audio and neither RWC nor any of its directors, officers, employees, or representatives (including affiliates) accepts any liability whatsoever for any errors and/or omissions or for any direct, indirect, special, incidental, or consequential loss, damages, or expenses of any kind howsoever arising from the use of, or reliance on, any information contained herein.Information contained in this audio should not be viewed as indicative of future results. Past performance of any Transaction is not indicative of future results. The value of investments can go down as well as up. Certain assumptions and forward looking statements may have been made either for modelling purposes, to simplify the audio and/or calculation of any projections or estimates contained herein and RWC does not represent that that any such assumptions or statements will reflect actual future events or that all assumptions have been considered or stated. Forward-looking statements are inherently uncertain, and changing factors such as those affecting the markets generally, or those affecting particular industries or issuers, may cause results to differ from those discussed. Accordingly, there can be no assurance that estimated returns or projections will be realised or that actual returns or performance results will not materially differ from those estimated herein. Some of the information contained in this audio may be aggregated data of Transactions executed by RWC that has been compiled so as not to identify the underlying Transactions of any particular customer.The information transmitted is intended only for the person or entity to which it has been given and may contain confidential and/or privileged material. In accepting receipt of the information transmitted you agree that you and/or your affiliates, partners, directors, officers and employees, as applicable, will keep all information strictly confidential. Any review, retransmission, dissemination or other use of, or taking of any action in reliance upon, this information is prohibited. The information contained herein is confidential and is intended for the exclusive use of the intended recipient(s) to which this audio has been provided. Any distribution or reproduction of this audio is not authorised and is prohibited without the express written consent of RWC or any of its affiliates.Changes in rates of exchange may cause the value of such investments to fluctuate. An investor may not be able to get back the amount invested and the loss on realisation may be very high and could result in a substantial or complete loss of the investment. In addition, an investor who realises their investment in a RWC-managed fund after a short period may not realise the amount originally invested as a result of charges made on the issue and/or redemption of such investment. The value of such interests for the purposes of purchases may differ from their value for the purpose of redemptions. No representations or warranties of any kind are intended or should be inferred with respect to the economic return from, or the tax consequences of, an investment in a RWC-managed fund. Current tax levels and reliefs may change. Depending on individual circumstances, this may affect investment returns. Nothing in this document constitutes advice on the merits of buying or selling a particular investment. This audio expresses no views as to the suitability or appropriateness of the fund or any other investments described herein to the individual circumstances of any recipient.AIFMD and Distribution in the European Economic Area (“EEA”)The Alternative Fund Managers Directive (Directive 2011/61/EU)(“AIFMD”) is a regulatory regime which came into full effect in the EEA on 22 July 2014. RWC Asset Management LLP is an Alternative Investment Fund Manager (an “AIFM”) to certain funds managed by it (each an “AIF”). The AIFM is required to make available to investors certain prescribed information prior to their investment in an AIF. The majority of the prescribed information is contained in the latest Offering Document of the AIF. The remainder of the prescribed information is contained in the relevant AIF’s annual report and accounts. All of the information is provided in accordance with the AIFMD.In relation to each member state of the EEA (each a “Member State”),this document may only be distributed and shares in a RWC fund(“Shares”) may only be offered and placed to the extent that (a) the relevant RWC fund is permitted to be marketed to professional investors in accordance with the AIFMD (as implemented into the local law/regulation of the relevant Member State); or (b) this audio may otherwise be lawfully distributed and the Shares may lawfully offered or placed in that Member State (including at the initiative of the investor).Information Required for Distribution of Foreign Collective Investment Schemes to Qualified Investors in SwitzerlandThe representative and paying agent of the RWC-managed funds in Switzerland (the “Representative in Switzerland”) FIRST INDEPENDENT FUND SERVICES LTD, Klausstrasse 33, CH-8008 Zurich. Swiss Paying Agent: Helvetische Bank AG, Seefeldstrasse 215, CH-8008 Zurich. In respect of the units of the RWC-managed funds distributed in Switzerland, the place of performance and jurisdiction is at the registered office of the Representative in Switzerland.