Financial inclusion lifts emerging and frontier markets
As banks in developed markets grapple with margin compression, their emerging market counterparts are capturing entirely new customer bases with minimal legacy infrastructure costs. We believe that the investment implications of financial inclusion are as attractive as they are unrecognized.
Financial inclusion—providing people and businesses with access to safe deposit facilities, credit, and capital markets—represents a compelling structural growth story. With 1.4 billion adults worldwide still excluded from formal banking services [1], emerging markets possess an extraordinary runway for economic expansion as cash-based economies transition into formal financial systems. This transformation will likely trigger the money multiplier effect, where deposits flow into banks and power broader economic growth through increased lending capacity and more efficient capital allocation.
Unlocking growth potential
One of the areas of growth potential is encouraging people to participate in the formal economy by allowing them access to bank accounts to deposit money and credit cards to make payments for goods and services. Compared to developed markets, the emerging markets of Asia, EMEA and Latin America could unlock huge growth potential simply by persuading the local population to open a bank account.
Chart 1: Unbanked adults by region (%)

There is a strong relationship between economic development and access to financial services. As countries become richer, more of the 1.4 billion adults who are currently unbanked open accounts at a financial institution; and where GDP per capita is high, financial institutions offer more sophisticated savings products to help funnel individual savings into collective investments.
Chart 2: GDP per Capita & Account Ownership (% of population >15 years old)

The progress of financial inclusion can be understood first by the ratio of deposits to GDP, and next by the adoption of other financial products once basic bank accounts have been opened. Emerging markets consistently show that the majority of people have bank accounts, but their deposit base is comparatively smaller than developed markets’ and the utilization of more sophisticated products and services, such as credit cards and mobile banking, is also lower [2]. Popular demand for more advanced financial products is expected to increase with, and fuel, economic growth.
GDP growth drives demand for financial services
One of the features of emerging markets is low GDP per capita but a higher growth rate, which leads to gradual convergence with developed markets.
Chart 3: GDP / capita (USD)

The less advanced stage of development means that fewer financial services are commonly in use; for example, relatively few credit cards are in issue in emerging markets and mobile banking has not taken off. Convergence with developed economies will take place gradually as economic growth and productivity increase wealth and the demand for financial products.
Chart 4: Access to financial products

It’s not just bricks and mortar
Digital banking options are rapidly expanding access to financial services globally. This growth is particularly notable in regions like Sub-Saharan Africa, where mobile money is transforming banking. As digital solutions rise, non-traditional access points increase, which should continue to make banking more accessible. Emerging markets are skipping traditional branch banking in favour of electronic and mobile banking.
Chart 5: Traditional and Non-traditional Access Points in Recent Years (2019-2023) (Number of Access Points Per 100,000 Adults)

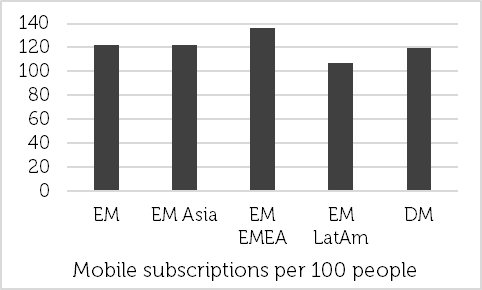
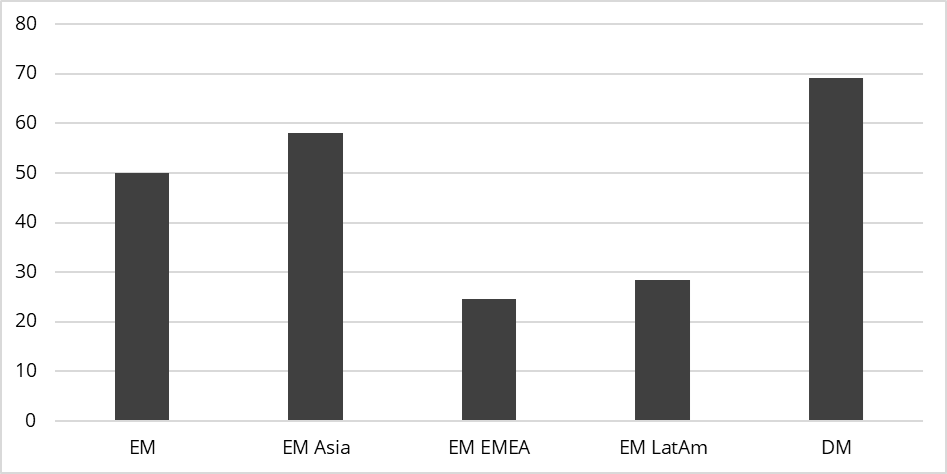
Financial institutions have historically built their customer base through their physical presence in cities and towns. Modern access to financial services is experiencing growth through the ease of transacting online and through mobile devices. There is virtually no difference in access to the internet or mobile telephony between developed and emerging markets.
Charts 6 and 7: Internet access and wireless access

Source: HSBC as of 30 April, 2025. The information shown above is for illustrative purposes.
Credit penetration shows room for growth
Emerging markets have been scarred by financial crises including the Tequila Crisis of 1994, the Asia Crisis of 1997 and the Global Financial Crisis of 2008. Although devastating at the time, these crises forged a preference for saving and a relatively prudent attitude towards the assumption of debt. Household debt to GDP is especially low in EMEA and Latin America, providing good long term growth potential in demand for consumer loans, credit cards, mortgages and eventually savings and insurance products.
Chart 8: Household debt / GDP (%)
Lower interest rates will support further growth and higher valuations
Financials have outperformed the MSCI Emerging Markets Index over the past 1, 3 and 5 years.
1 Year to 30/4/25 | 3 Years to 30/4/25 | 5 Years to 30/4/25 | |
|---|---|---|---|
MSCI EM | 9.6% | 4.3% | 6.7% |
MSCI EM Financials | 18.8% | 7.9% | 11.6% |
Source: Bloomberg as of 30 April, 2025. Past performance is not a guide to the future.
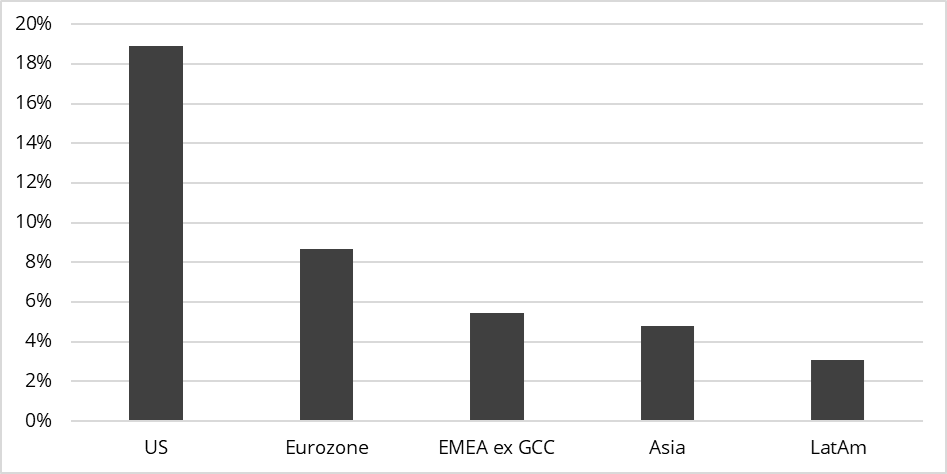
The next leg of growth and performance should be sparked by lower interest rates. Fed Funds Futures indicate that the Federal Reserve should resume cutting the Fed funds rate in the second half of 2025, which would allow emerging market central banks to reduce their own interest rates as well. This should support further credit penetration and help improve the value of financial services within emerging markets; the low rate of market capitalization indicates immaturity in comparison with Europe and the US.
Chart 9: Financials market capitalization as a % of GDP
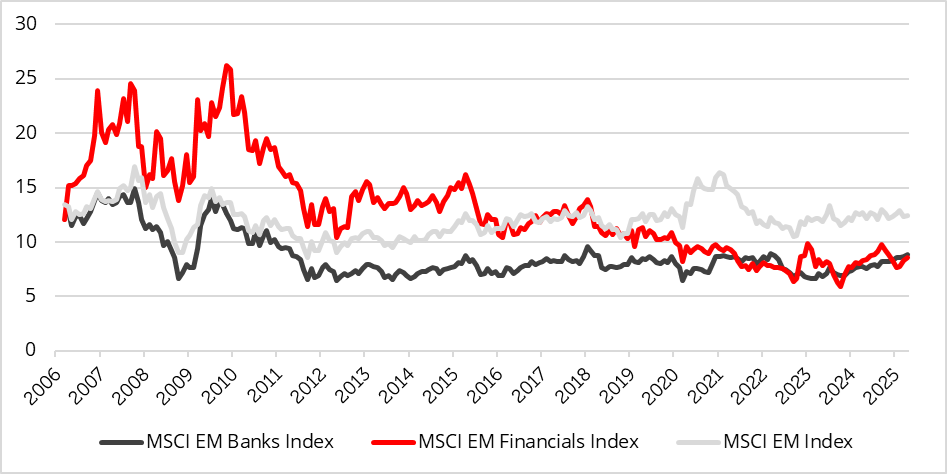
Lower interest rates should also allow valuations to expand. Although they used to be valued close to parity, emerging market financial institutions have tended to trade at a discount to the MSCI Emerging Market Index in recent times, giving them a GARP characteristic.
Chart 10: P/E
Case study: Capitec
Formed as a micro-lending institution, Capitec Bank Holdings provides banking services including saving, credit and transacting for retail and SME clients in South Africa. The company has grown fast and is positioned to benefit from its expansion into business banking, credit cards, funeral plans and insurance products. Its lean cost structure permits a price-led expansion strategy in pursuit of market share. South Africa’s recovering economy supports revenue and profit gains.
Chart 11: Capitec loans / deposits (ZAR)
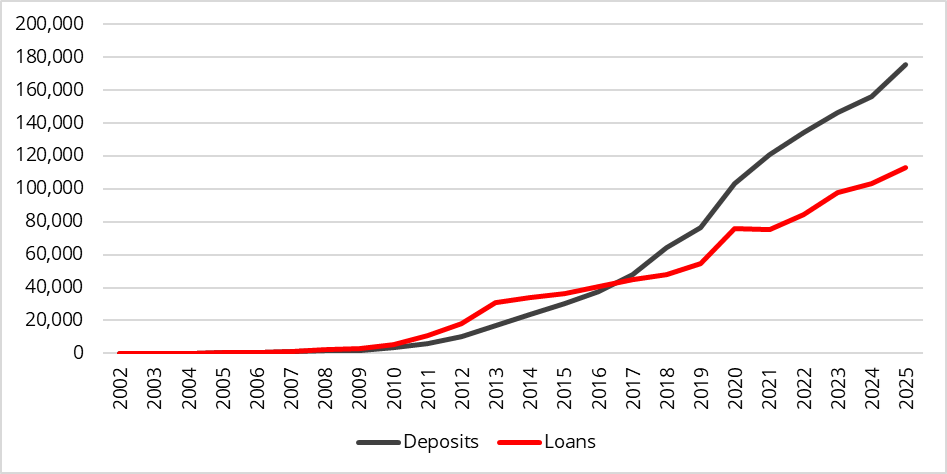
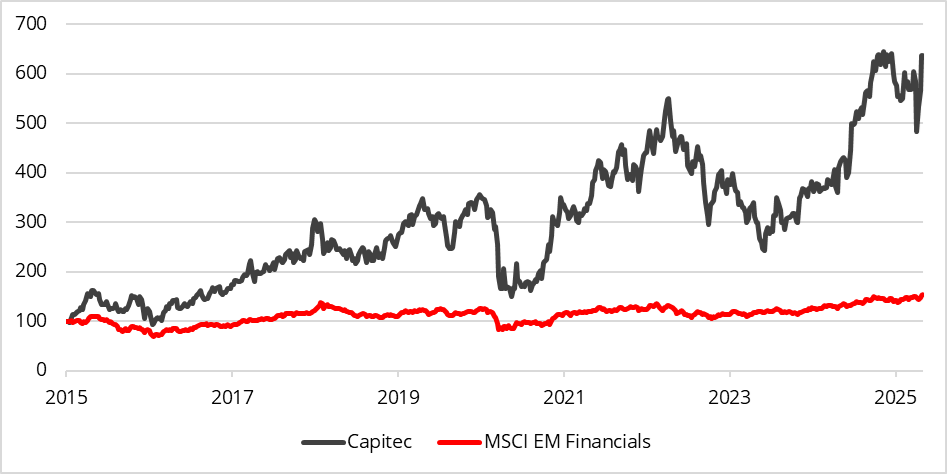
Growth in the core deposit-taking and lending business has contributed to the company’s shares significantly outperforming the MSCI Emerging Markets Index.
Chart 12: Performance (normalized to 100)
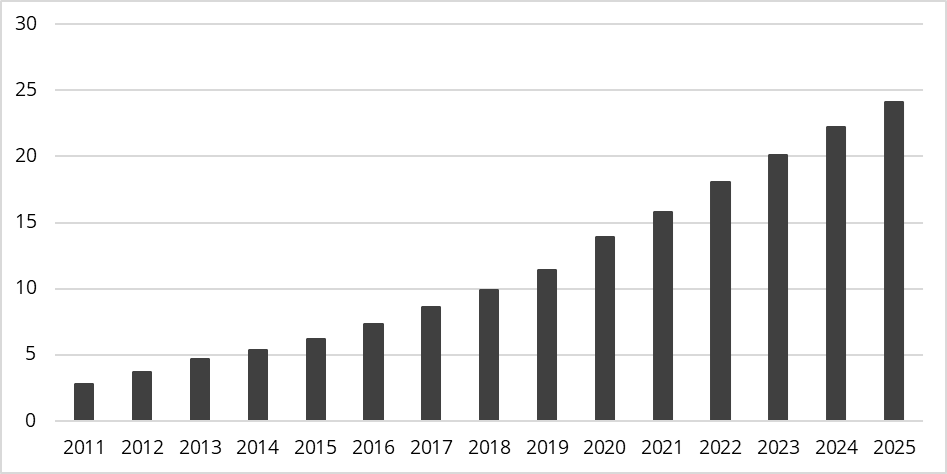
Digital innovation is at the forefront of Capitec’s expansion, with app clients increasing 15% to 12.9 million in FY2025. The implementation of digital banking solutions and a unified app for business and personal banking has enhanced the customer experience while boosting operational efficiency. In FY2025, value-added services and Capitec Connect grew 61% to R4.4 billion. This strong performance demonstrates how digital distribution channels have enabled the bank effectively to reach customers beyond its traditional banking footprint.
Chart 13: Active clients at Capitec Bank (millions)
Key Information
No investment strategy or risk management technique can guarantee returns or eliminate risks in any market environment. Past performance is not a guide to the future. The prices of investments and income from them may fall as well as rise and investors may not get back the full amount invested. Forecasts and estimates are based upon subjective assumptions about circumstances and events that may not yet have taken place and may never do so. The statements and opinions expressed in this article are those of the author as of the date of publication, and do not necessarily represent the view of Redwheel. This article does not constitute investment advice and the information shown is for illustrative purposes only.
Sources:
[1] World Bank, 2021
[2] HSBC, April 2025

