









Where have I heard this song before
A man’s music streaming history is a deeply personal thing; see his ‘Recently played’ list and see his soul (and, probably, his secret Taylor Swift obsession). For me, one of my favourite genres – despite living in leafy London virtually all my life – is the deep twang of Country & Western, which has made a rapid comeback in the past few years.
One of Country’s modern greats is Oklahoman Toby Keith, a former oil derrick hand who turned to music when the industry experienced one of its (many) down cycles. One of my personal Keith favourites is Wish I Didn’t Know Now, a bittersweet ballad that was most recently covered by new breakout Country star Ella Langley. The song paints a picture of a lover who suspects infidelity but looks the other way to preserve the relationship, until the issue forces itself and the singer has no choice but to leave. Lamenting that they unwillingly had to confront the truth, and end the relationship, the singer muses:
“I wish I didn’t know now what I didn’t know then”
As our regular readers know, we believe that all great forms of art contain key lessons for the discerning investor – and country music (arguably one of the greatest forms of art?) is certainly no exception.
Today, those investors listening carefully to the market can hear the plaintive refrain of a song that they have heard before, offering a timely warning to those who are ignoring the growing signs of distorted valuations. Like the agonised lover, many investors, in our view, are desperately looking the other way, in a vain attempt to forget what they didn’t know the last time this happened: way back in 1999.
A new millennium all over again
Everywhere investors look today, they are being bombarded with warning signs of history repeating itself, an inevitability in the capital markets where capital meets human emotions time and time again. Signs of excess – or at the very least, extreme enthusiasm baked into valuations and activity – are ubiquitous, and our ears are ringing with the myriad sound of warning bells.
Take, for instance, the recent mammoth IPO of SpaceX, a ground-breaking and admirable company by all accounts, but one which was priced at an eye-watering 75x revenue (that’s the top line, dear readers, not the bottom one) [1]. Given that most of its perceived total addressable market (‘TAM’) is in consumer AI, where it and large rivals OpenAI and Anthropic have yet to turn a profit, this sort of valuation warrants, at minimum, a raised eyebrow. This contributed to what was the single largest month for IPOs on record in the US, with $185bn raised in June 2026, handily eclipsing the heady highs of 2021 and 1999.
Chart 1: Monthly US IPO issuance since 1990
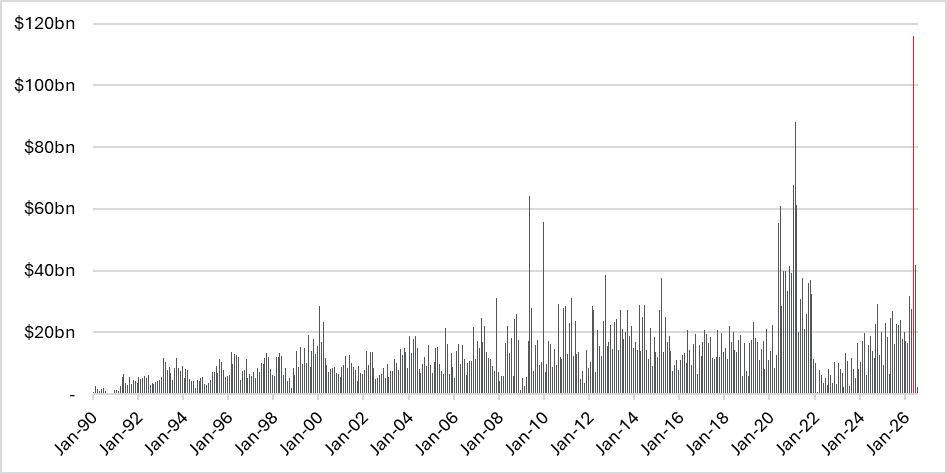
The fact that high-growth companies are opportunistically coming to the market today should not surprise those investors watching closely. After all, as the saying goes: when the ducks quack, feed them. And at current valuations, the ducks are quacking for an ever-increasing supply of expensive equity paper.
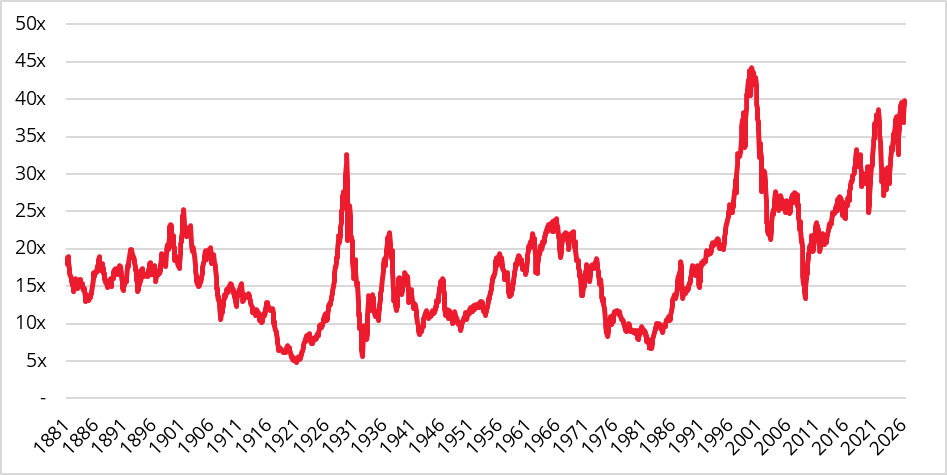
Testament to this insatiable demand, other than the $1tn poured into US-listed ETFs in the first six months of 2026, [2] is the soaring heights reached by market valuations, which can be measured across a number of metrics. One of the most widely respected and commonly used is the Cyclically Adjusted Price-to-Earnings Ratio (‘CAPE Ratio’), publicised by economist Robert Shiller in his seminal 2000 book, Irrational Exuberance, and commonly referred to as the Shiller PE.
The measure compares today’s market valuations with the ten-year average of US corporate earnings, adjusted for inflation to show what investors are paying for a normalised earnings profile over a cycle. This metric peaked in December 1999 at an eye-watering 44.2x ten-year average earnings, eclipsing the September 1929 peak of 32.6x, the next highest watermark. Today, however, the Shiller P/E stands at a whopping 39.5x, substantially above the levels seen in 1929, and now the highest reading in any year since the 1999 / 2000 dotcom bubble.
Chart 2: S&P 500 – Shiller P/E ratio
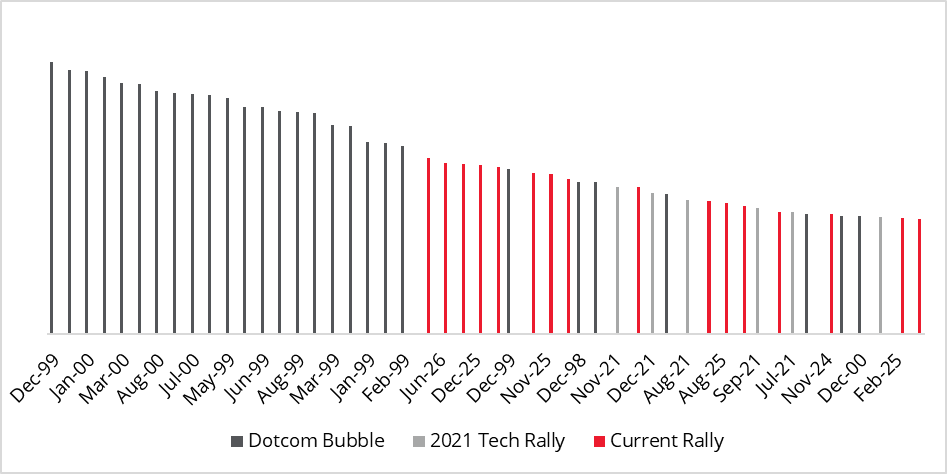
Now, this is a pretty comprehensive dataset: Yale professor Robert Shiller, who compiles this data, has monthly numbers for the S&P 500 going back to 1881. The most expensive 50 months in that dataset – out of a total of more than 1,700 months – are shown on the chart below. Notably, more than half of those months (28 in total) occurred in the dotcom bubble, across 1998 – 2000. Six were during the tech rally in 2021, which subsequently saw the S&P 500 plummet 18% in 2022. The remaining 32% of the most expensive 50 months have happened in the past three years, including every single month in 2026 other than March. That means that every single month in the top 50 most expensive months in the last 145 years was part of one of three tech-driven bubbles since 1999: the dotcom bubble, the ill-fated 2021 tech rally – and today’s exuberant bull market.
Chart 3: S&P 500 – Top 50 highest monthly Shiller P/E ratios
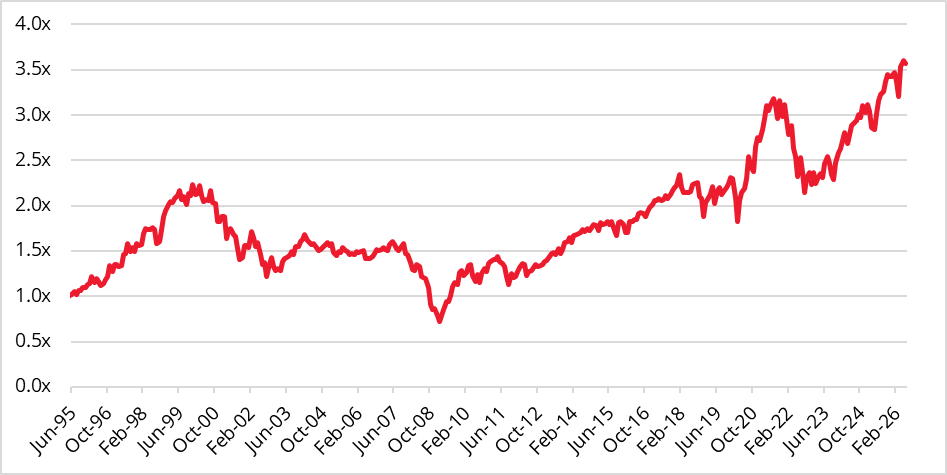
Looking at another metric of valuation bears out the same point: using a price-to-sales ratio, which helps look through some potentially inflated operating margins, the same phenomenon can be observed for the US market.
Chart 4: S&P 500 – Price-to-sales ratio, 1995 – 2026
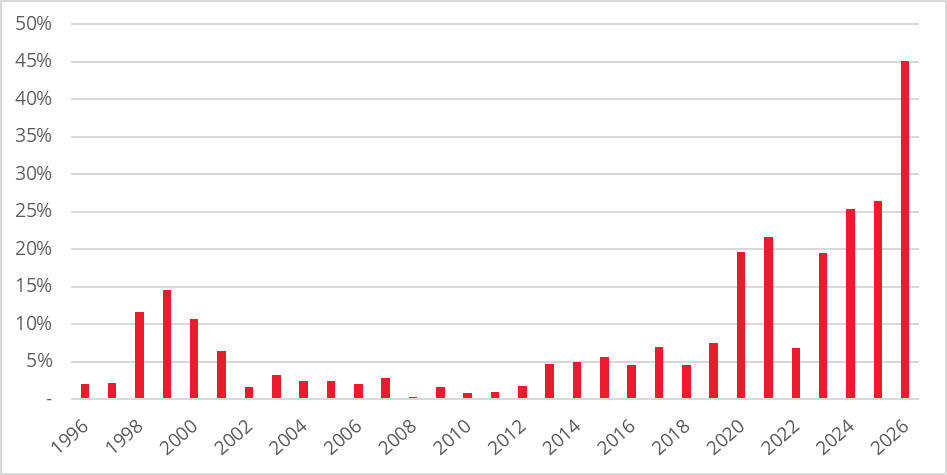
Not only is the overall market expensive, but this high valuation is being increasingly driven by a handful of hugely expensive companies, which make up an increasingly large proportion of the index. Back in the booming bubble of 1999, nearly 15% of the S&P was composed of companies sporting valuations of over 10x sales, a huge number that embeds extreme optimism about the future. That number today? Nearly 45%.
Chart 5: S&P 500 – Proportion valued above 10x sales
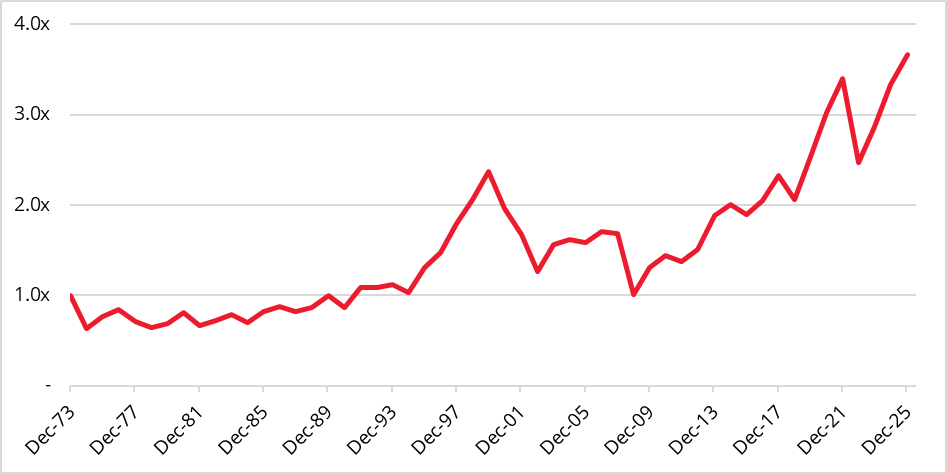
Indeed, everywhere one looks, echoes of the dotcom bubble abound. A simple but effective measure – favoured by a famous Omaha retiree, one Mr. Warren Buffett – is to compare the level of the aggregate US equity market to its level of GDP. Much like the Shiller P/E and price-to-sales metrics above, this measure is also flashing dangerous warning signs reminiscent of 1999.
Chart 6: US equity market / US GDP, 1973 – 2026
Of course, during the dotcom bubble, these eye-watering levels of valuation were driven principally by a single sector, technology, which was basking in the glow of the newly discovered “internet”, and all the magnificent promises that it held. Once again, it does not take a Holmes-level of sleuthing to see that the very same sectors and industries are propelling the US equity market – today, more than 70% of the global market [3] – to ever more nosebleed-inducing highs – see Chart 7.
A semi-serious problem
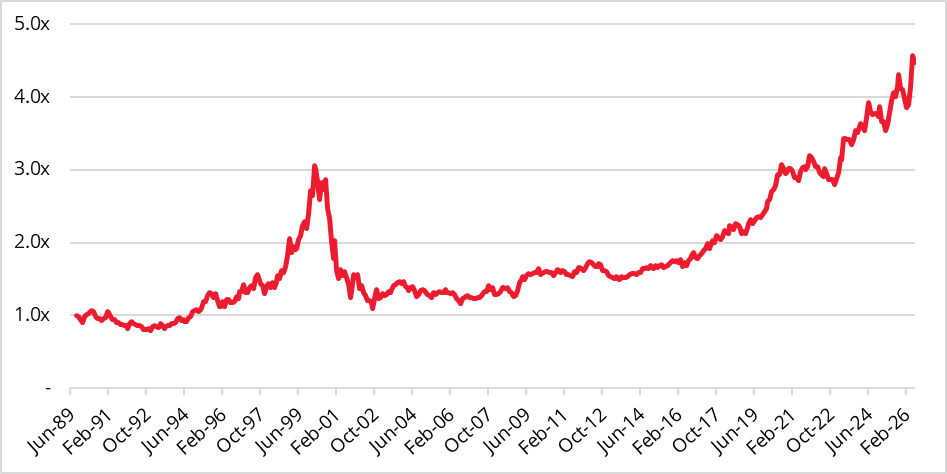
Much like in 1999, the surging rally in 2026 has once again come from extreme performance in the technology sector, which now sits at its highest relative to the index since March 1999.
Chart 7: S&P Technology sector / S&P 500, 1989 – 2026
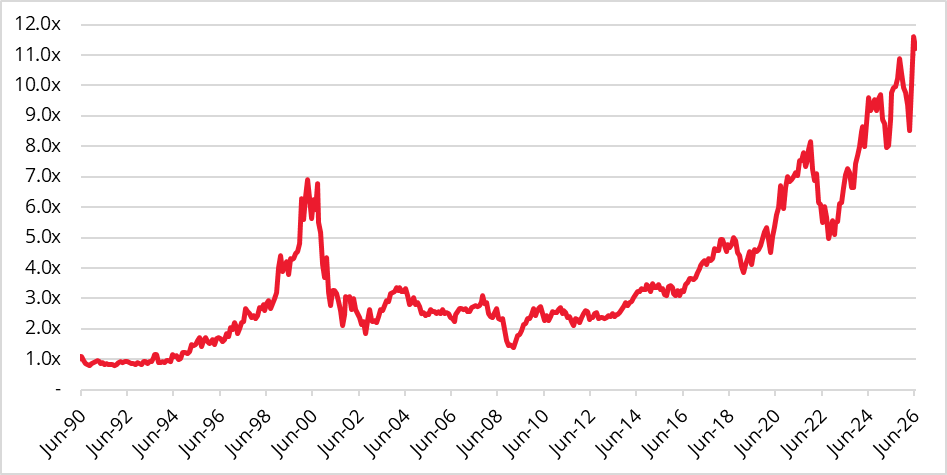
Alas, this performance is not simply being driven by corporate fundamentals: as shown below, what is driving the level of the technology sector is an enormous increase in valuation, with the price to sales – a necessary shorthand, given the number of unprofitable technology companies – eclipsing its 1999 highs:
Chart 8: S&P Technology sector – Price-to-sales ratio, 1990 – 2026
This is being increasingly driven by huge concentration in a handful of names, akin to other periods of market excess. Today, the ten largest technology companies – NVIDIA, Apple, Microsoft, Amazon, Alphabet, Broadcom, Meta, Tesla, Micron and AMD – comprise 40.5% of the S&P 500, a level of concentration echoing the TMT sector at 41% of the market in 1999, and the Nifty Fifty at 40% in the peak at the very start of 1973 [4]. The phenomenal performance of the US technology sector, historically a bellwether for bubble conditions, also sits atop a mini-bubble of its own: that of semiconductor companies.
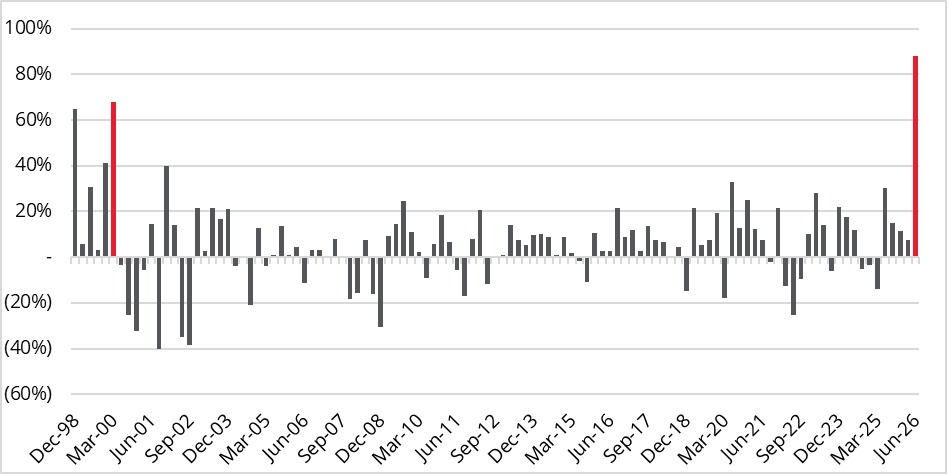
Semiconductor companies are the architects of a modern technological miracle: the design and fabrication of some of the smallest and most complex physical structures that humanity creates. Behind this incredible testament to human ingenuity, however, is a highly cyclical and capital-intensive business, with an array of companies both in the US and overseas competing fiercely across an agonising boom-and-bust cycle. The largest semiconductor companies in the US are tracked by the Philadelphia Semiconductor Index, the SOX Index, which was established in 1996. The SOX, much like the technology sector, has exploded wildly in the last six months, up by over 75% in 2026 [5]. Investors with good hearing and long memories may shudder at the sound of such performance: after the second quarter of 2026, the next best quarterly performance period for the SOX Index? Q2 2000, of course, in the teeth of the dotcom bubble.
Chart 9: Philadelphia Semiconductor Index – Quarterly returns, 1996 – 2026
In the Knick of time
I have left the final, most damning piece of evidence for last. This, if nothing else, should convince you that we are close to a dotcom-style top.
As avid basketball fans will know, the most recent NBA season treated Big Apple residents to an unprecedented run by the New York Knicks, a team that had failed to even make the finals for nearly three decades. All that changed in the 2026 season when the inimitable Jalen Brunson led his barnstorming team to the NBA Championship title.
When, you might ask, was the last time that the Knicks reached the finals of the NBA? I suspect that if you have made it this far, you know the answer: it was in 1999! Not only that, but in 1999 they faced the same team then as they did in 2026 – the San Antonio Spurs – an eerie echo orchestrated, it seems, by the stock market gods. Even more astonishingly, the Knicks last won the NBA Championship in 1973 – the year that the Nifty Fifty bubble popped and imposed a brutal 48% drawdown on investors over an 18-month period [6]. Perhaps they should change their team logo to a bear.
************
In the first episode of the TV series Landman – with its soundtrack heavy with Texan twangs and superb country music – oil fixer Tommy Norris comforts his cheerleading daughter after a rough breakup – a breakup he saw coming. Lamenting on her state of affairs, she asks him:
“Daddy, how come you’re always right?”
To which Norris gives an answer worthy of the very best investor:
“Cause I spent all my life being wrong, and I never forgot the lessons.”
Strange basketball happenings aside, the indicators today are plain for investors to see – in equity market valuations, the IPO frenzy, and the incredible heights being reached by technology and semiconductor companies. They are quite clearly sounding the alarm for investors, and – unlike the betrayed lover in our Toby Keith country song – investors would do well to be more like Tommy Norris: recalling the lessons of the last time this happened.
Sources:
[1] Bloomberg, June 2026
[2] Goldman Sachs Global FICC and Equities, June 2026
[3] Bloomberg, June 2026
[4] Bloomberg, June 2026
[5] Bloomberg, June 2026
[6] Bloomberg, June 2026
Key Information
No investment strategy or risk management technique can guarantee returns or eliminate risks in any market environment. Past performance is not a guide to the future. The prices of investments and income from them may fall as well as rise and investors may not get back the full amount invested. Forecasts and estimates are based upon subjective assumptions about circumstances and events that may not yet have taken place and may never do so. The statements and opinions expressed in this article are those of the author as of the date of publication, and do not necessarily represent the view of Redwheel. This article does not constitute investment advice and the information shown is for illustrative purposes only.