








Convertible bonds provide a hybrid solution for investors looking for a balanced exposure to financial markets that combines the attractive elements of both equities and bonds. They aim to deliver upside participation in rising markets while helping protect capital during downturns.
Emerging & Frontier Markets strategies focus on capturing high-growth opportunities across the world’s fastest-growing economies. With a long-standing, index-agnostic approach, the team invests both directly in these markets and in developed market companies with significant exposure to them.
By harnessing the power of dividends, our team aims to deliver a combination of income and long-term capital growth by investing in a diversified portfolio of global equities. The strategy is designed for investors seeking a disciplined approach, targeting a rare combination of premium yield, durable income, and attractive valuation, while selectively investing in overlooked opportunities where short-term controversies have created potential mispricing
Redwheel’s Global Intrinsic Value team is led by Ian Lance and Nick Purves, who each have over 30 years’ investment experience and have worked together for nearly 20 years across multiple market cycles. Alongside a team of global analysts, they are dedicated value investors seeking to identify undervalued, durable companies with strong cash flows and robust balance sheets.
Structural shifts driven by regulation, technological innovation, and the global energy transition are creating long-term growth opportunities across infrastructure sectors. Our team invests in publicly traded companies across developed and emerging markets that provide essential services and assets supporting economic activity and societal development.
Our Natural Capital strategy seeks to deliver long-term capital growth by investing in global companies that contribute to the preservation and restoration of the planet’s natural resources. As ecosystems come under increasing pressure from pollution and resource depletion, while remaining fundamental to economic and societal stability, we see a compelling opportunity in nature-positive solutions.
Our Active Ownership strategies are built on the belief that companies with active, engaged shareholders are more likely to generate superior long-term returns. The core focus of the strategies is to invest in concentrated portfolios of European and Japanese companies that are receptive to engagement, targeting fundamentally sound businesses with significant upside potential over a three- to five-year time horizon.

At Redwheel, Stewardship is our overarching approach to responsible investing, bringing together Sustainability, Active Ownership and Greenwheel Research & Insights into a single, disciplined framework. Through this framework we integrate material sustainability considerations into investment decisions, support investment teams with central expertise, and use focused engagement, proxy voting and thematic research to protect and enhance long-term client outcomes.

The charts below formed part of our recent Halloween-themed webinar, Spooky Charts: What Could Investors Be Missing?’. While the seasonal scares may have passed, the market trends shared below should still give investors pause for thought.
Beneath the buoyant surface of today’s equity markets lurk several haunting indicators. As bond yields climb to multi-year peaks, the decade-long regime of cheap money and suppressed yields has vanished. Yet broader equity markets, particularly in the US, continue to party like there are no skeletons in the closet.
When we examine the anatomy of the current market environment, several eerie trends reveal an uncomfortably high degree of investor complacency.
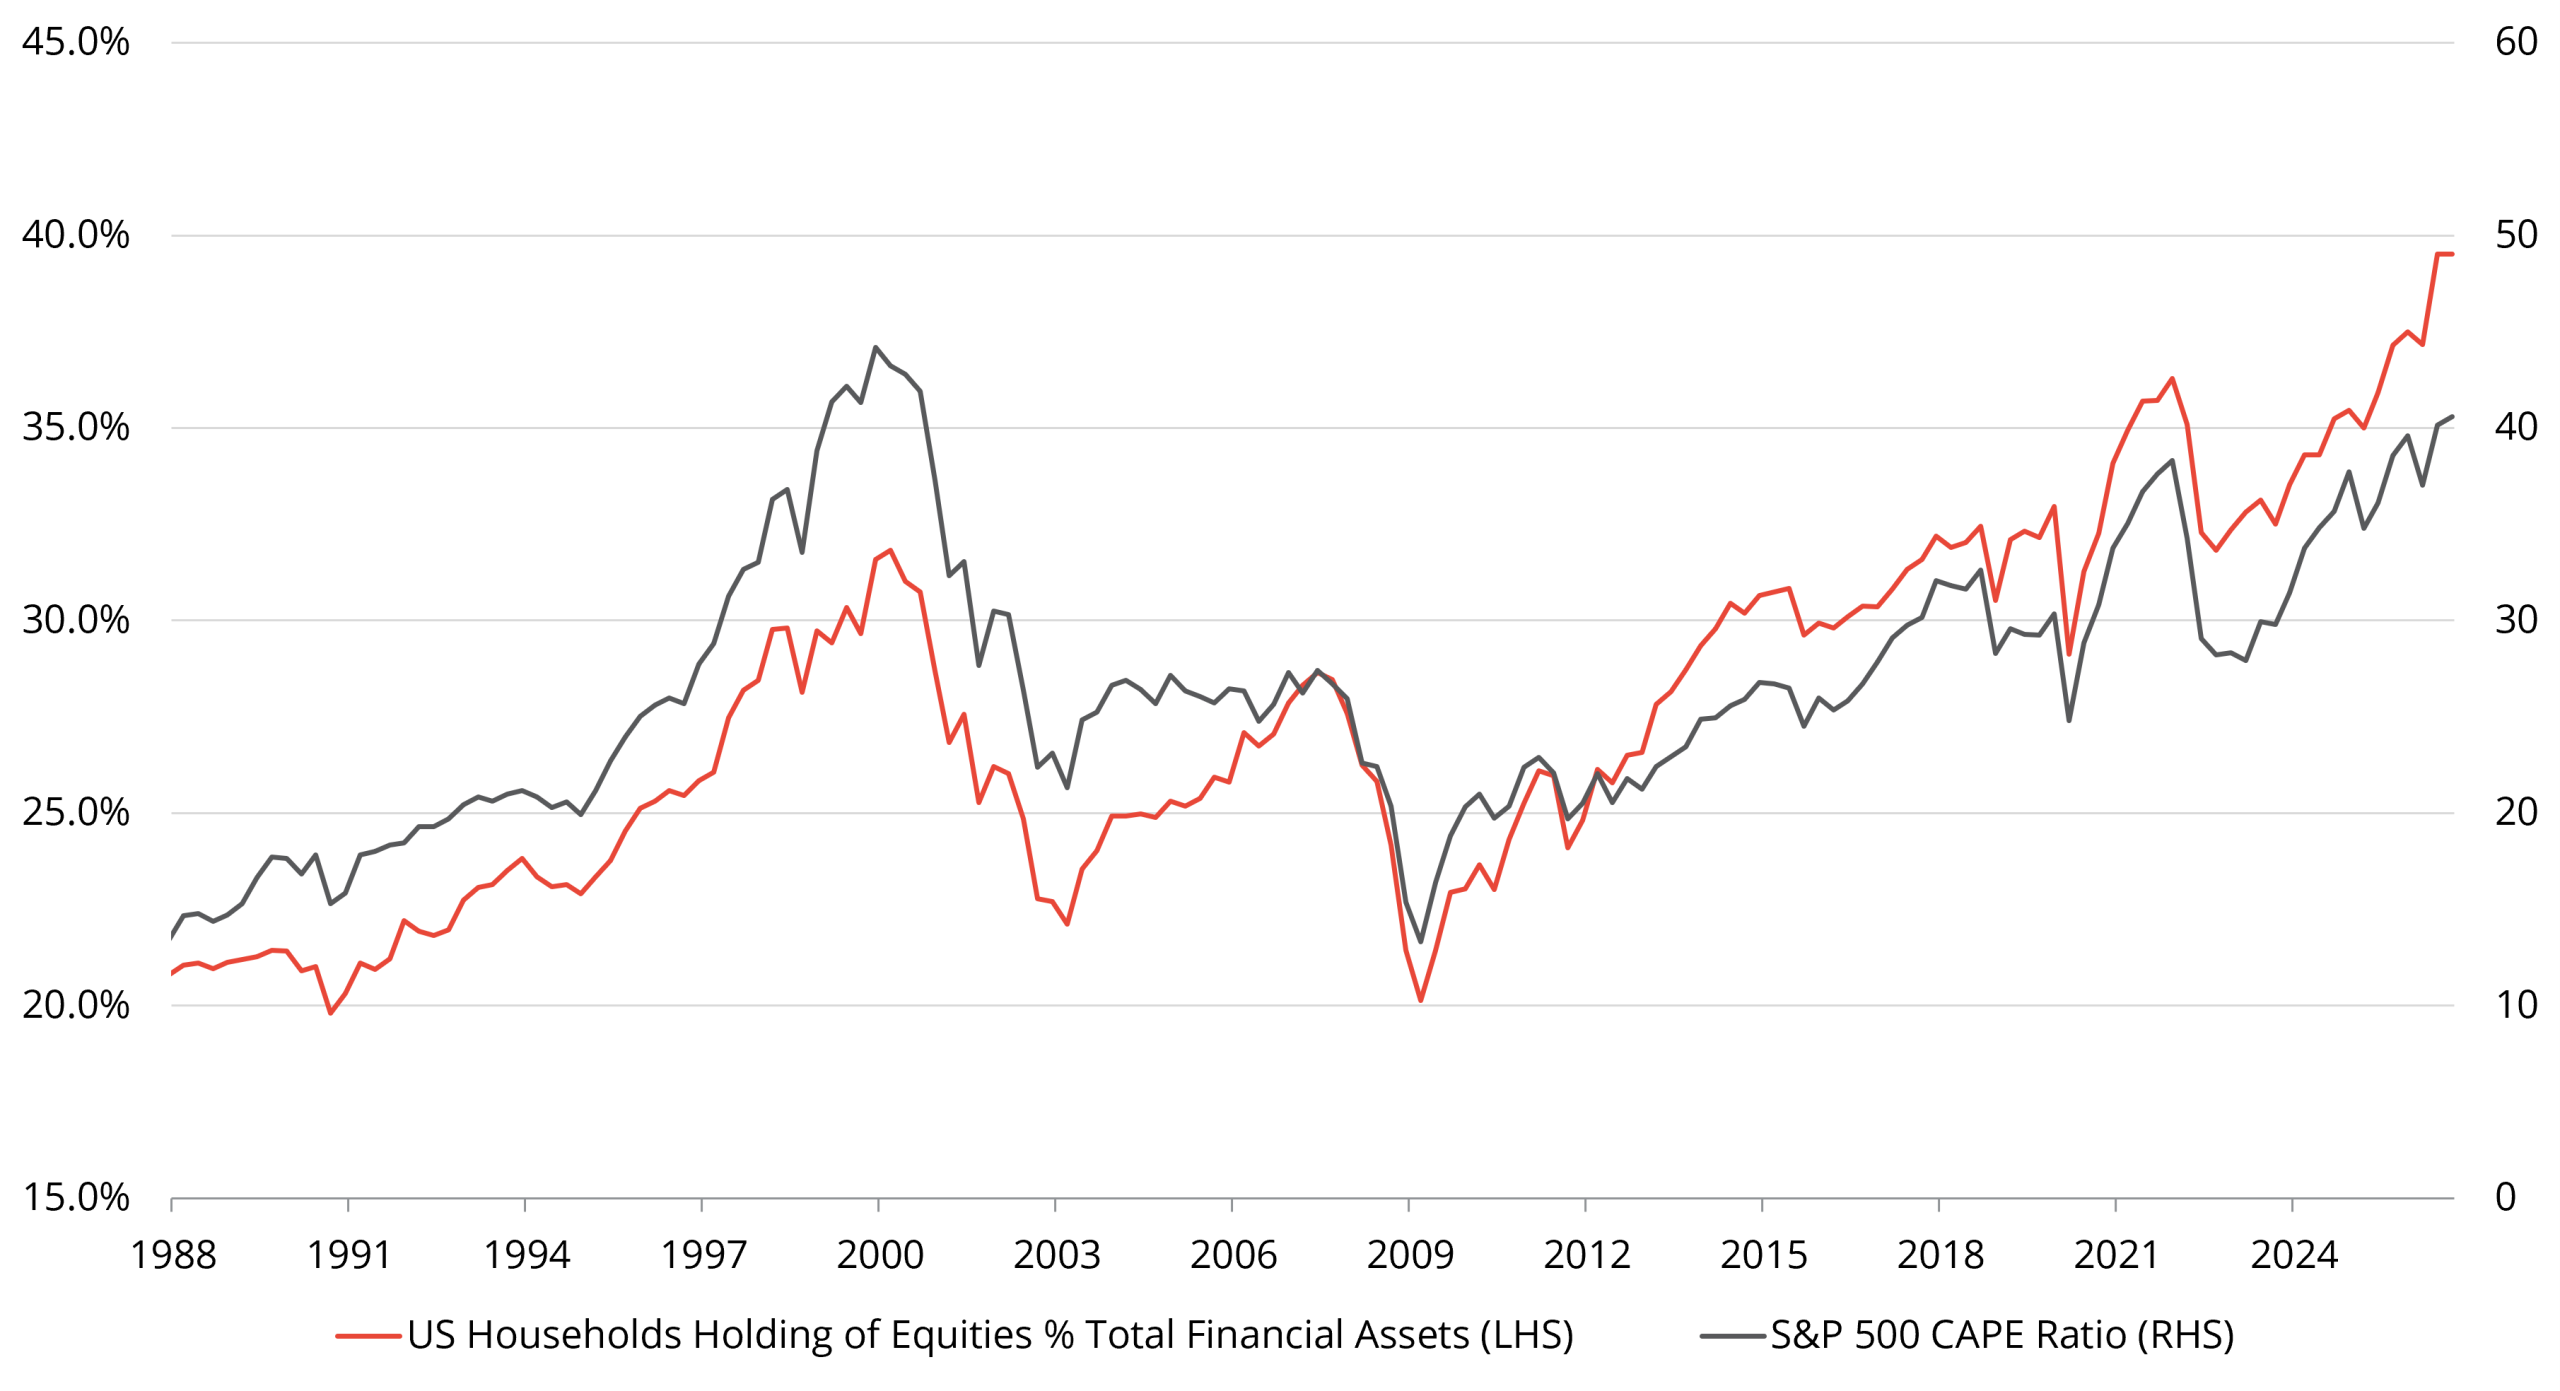
The first chilling signal lies in the mirror image of US household equity allocations and market valuation multiples.
Chart 1: US Equities – Valuations and Allocations
US retail investors have piled into equities at proportions rarely witnessed in modern market history. Rather than trimming risk as multiples approach dot-com levels, households have doubled down. Ignoring the valuation monster at the door, in our view, may leave portfolios with little liquidity buffer to absorb unexpected market shocks.
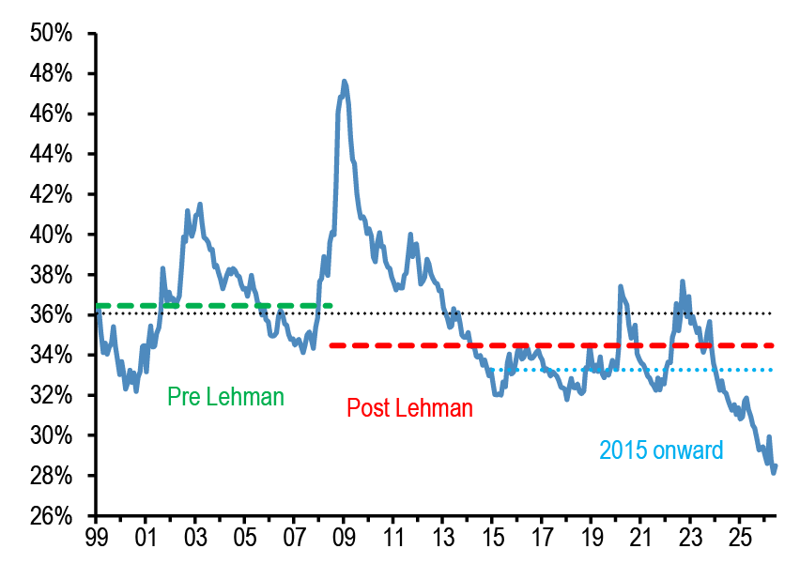
Equally ghostly is the disappearance of liquidity reserves across global markets.
Chart 2: Implied cash allocation by non-bank investors globally
Cash holdings among non-bank investors worldwide have withered to their lowest levels in roughly three decades. Investors have thrown caution to the wind, leaving little cash cushion to protect against unexpected drawdowns or to seize mispriced opportunities if market panic were to strike.
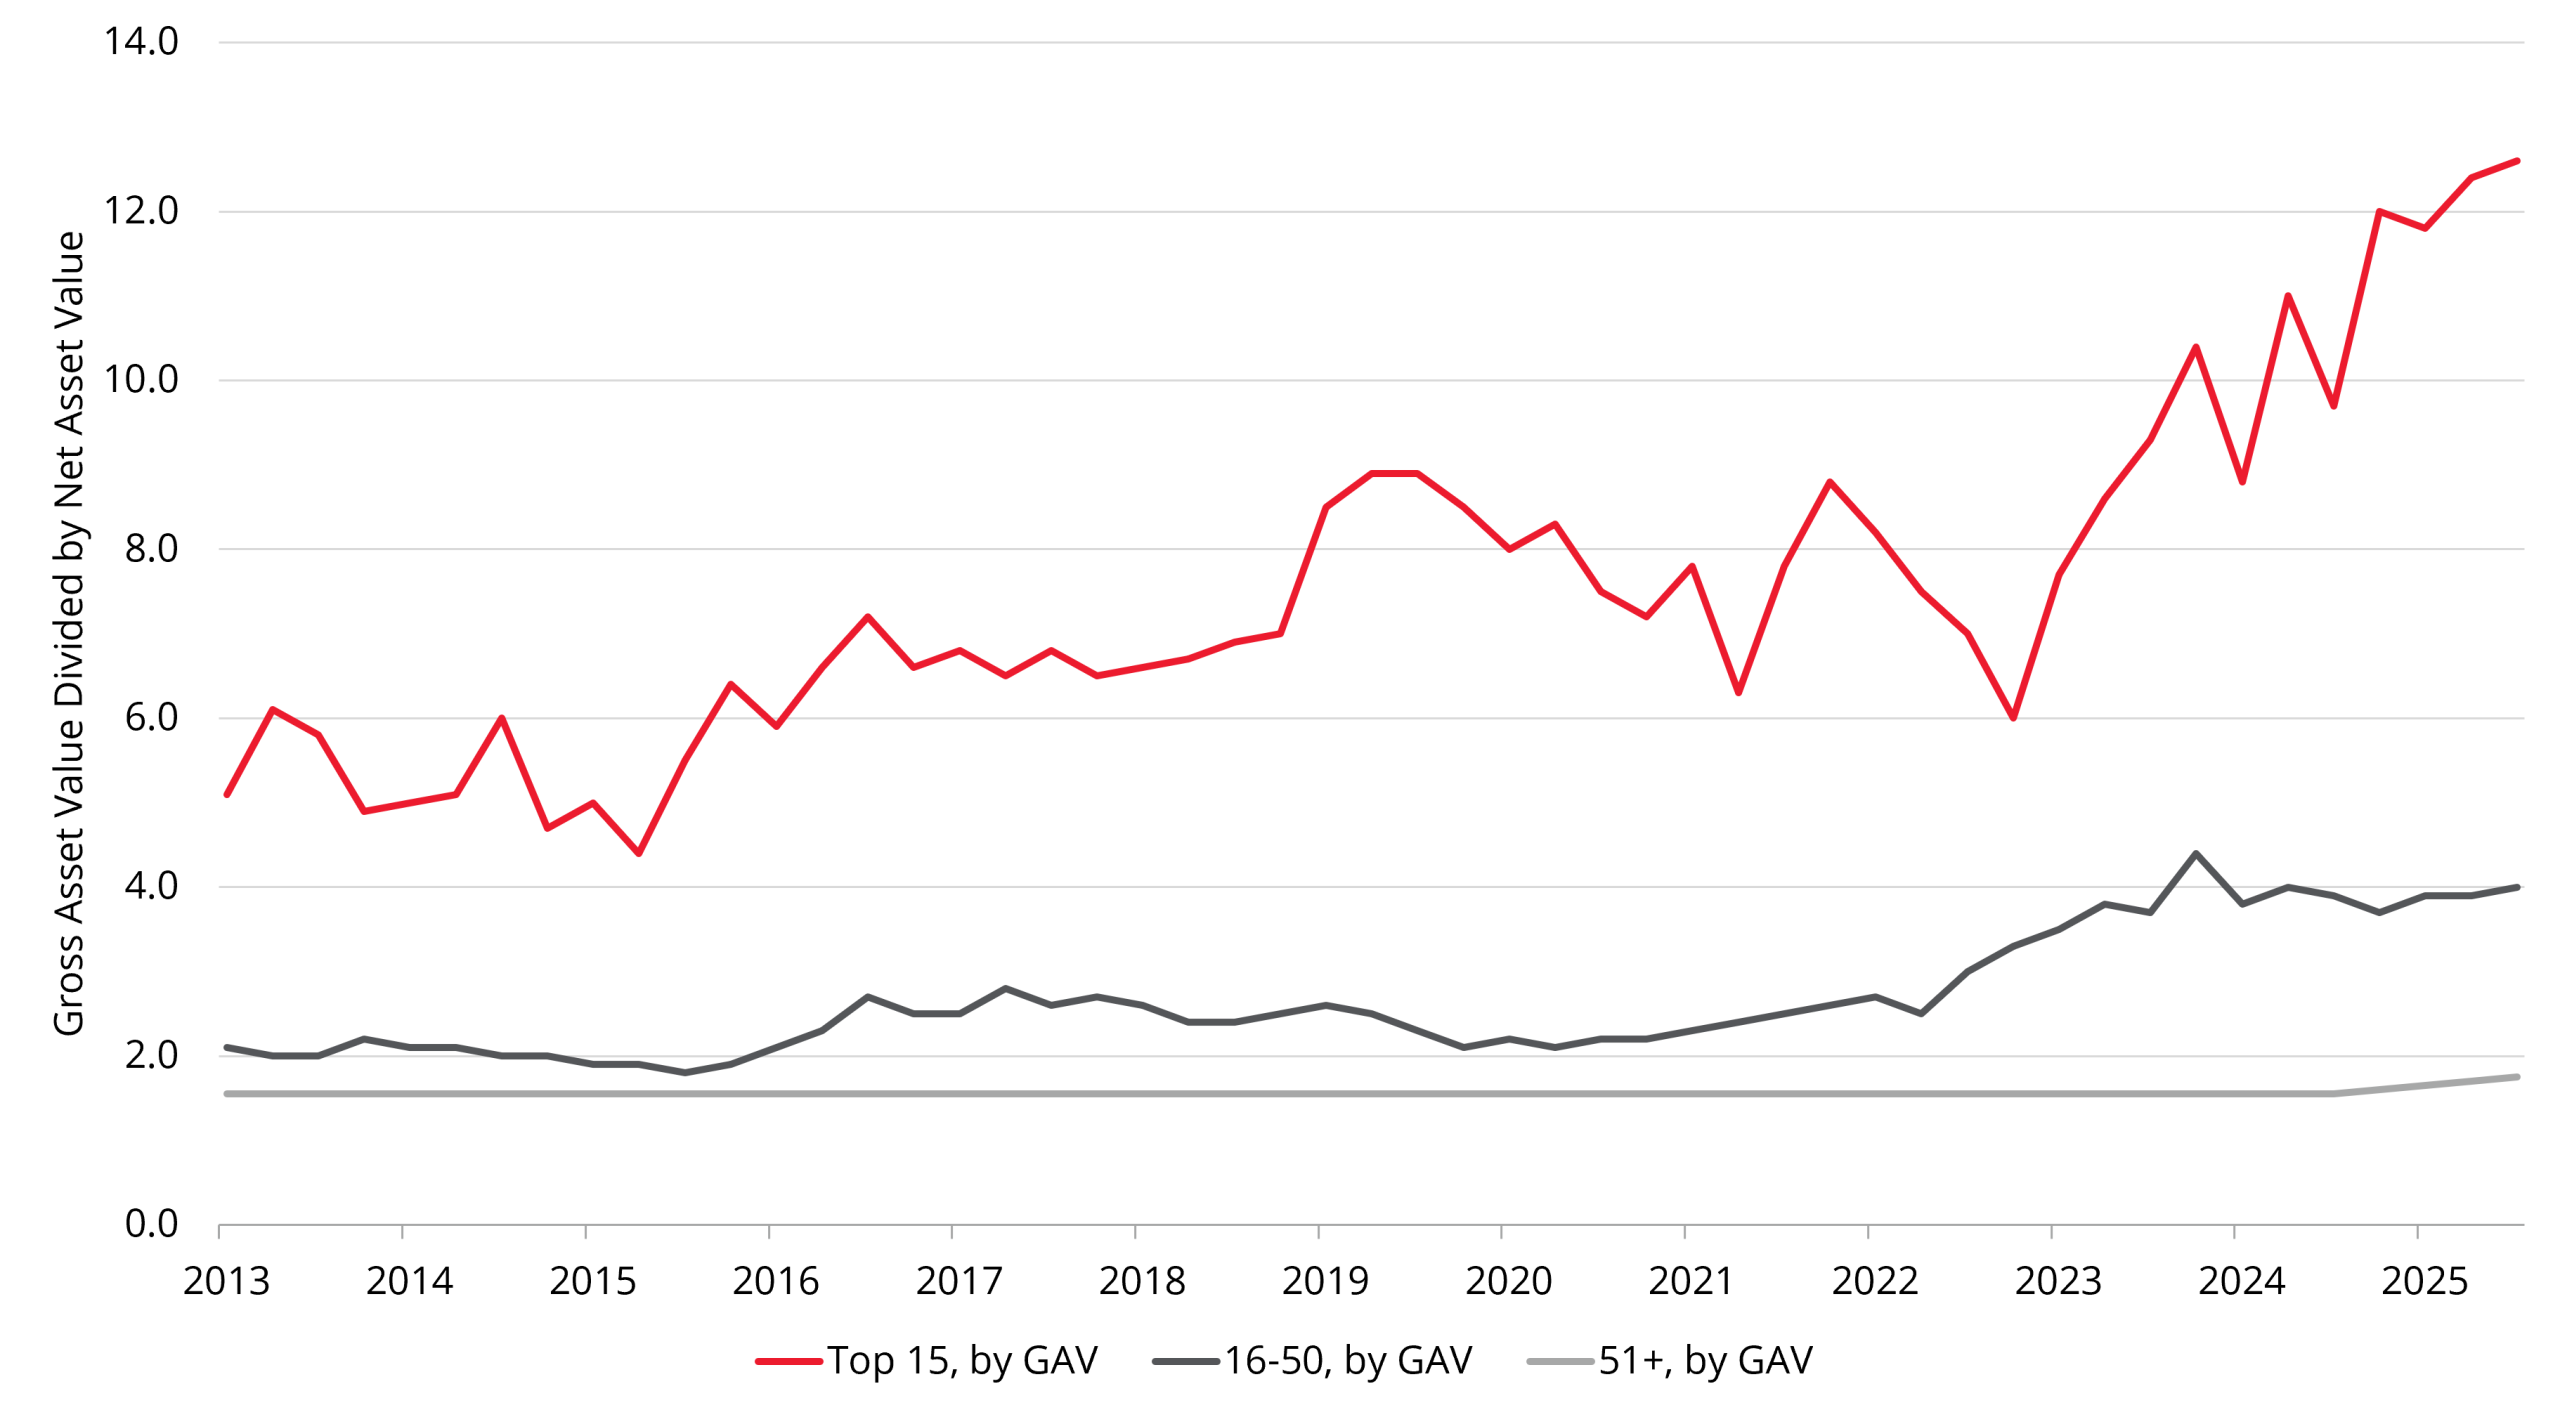
The scare factor intensifies when looking at institutional positioning. The world’s largest hedge funds have increased their balance sheet leverage to elevated levels, running gross leverage multiples well above historical norms.
Chart 3: Balance Sheet Leverage of World’s Largest Hedge Funds
Balance sheet leverage for the top 15 mega-funds has doubled in the past decade essentially maxing out capacity. When institutional capital is geared heavily into crowded trades, even modest market adjustments can contribute to rapid deleveraging.
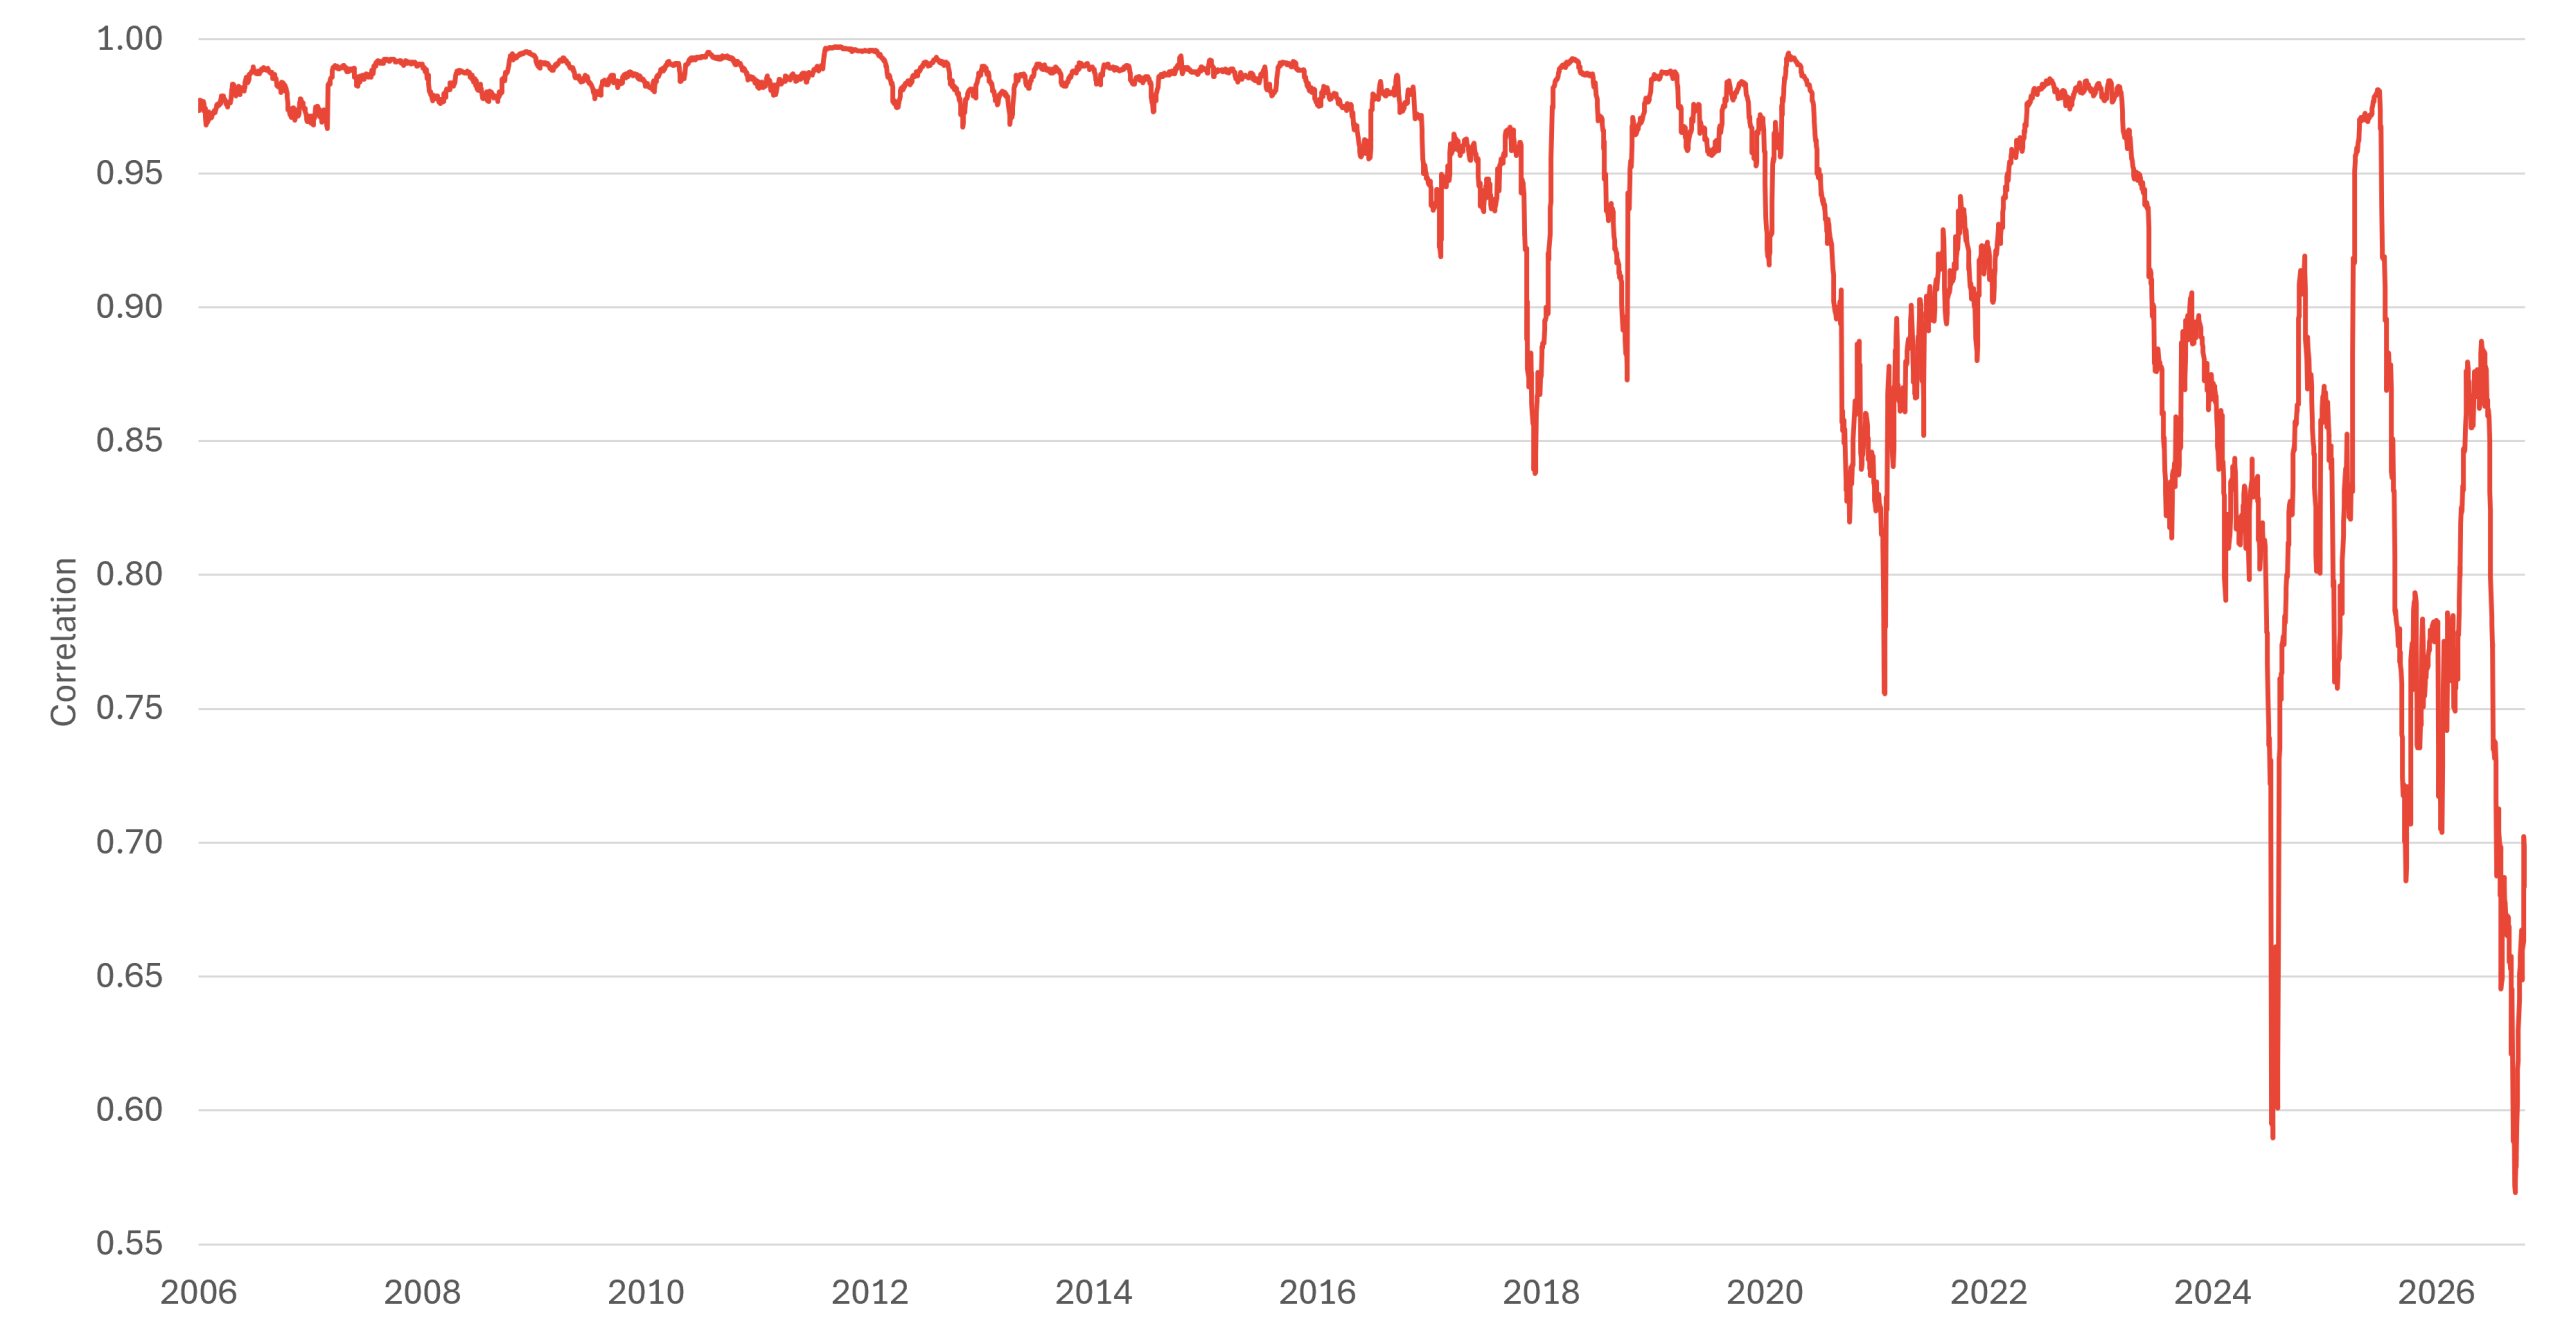
Today, the top 10 companies in the US represent roughly 40% of the entire index—all within technology. To illustrate how narrow market leadership has become: if 485 companies in the S&P 500 were excluded (including blue chip stalwarts like Johnson & Johnson and Walmart), the remaining index heavyweights would keep the headline benchmark above its 2020 peak.
Chart 4: S&P 500 vs S&P 500 Equal Weight 3m Realised Correlation
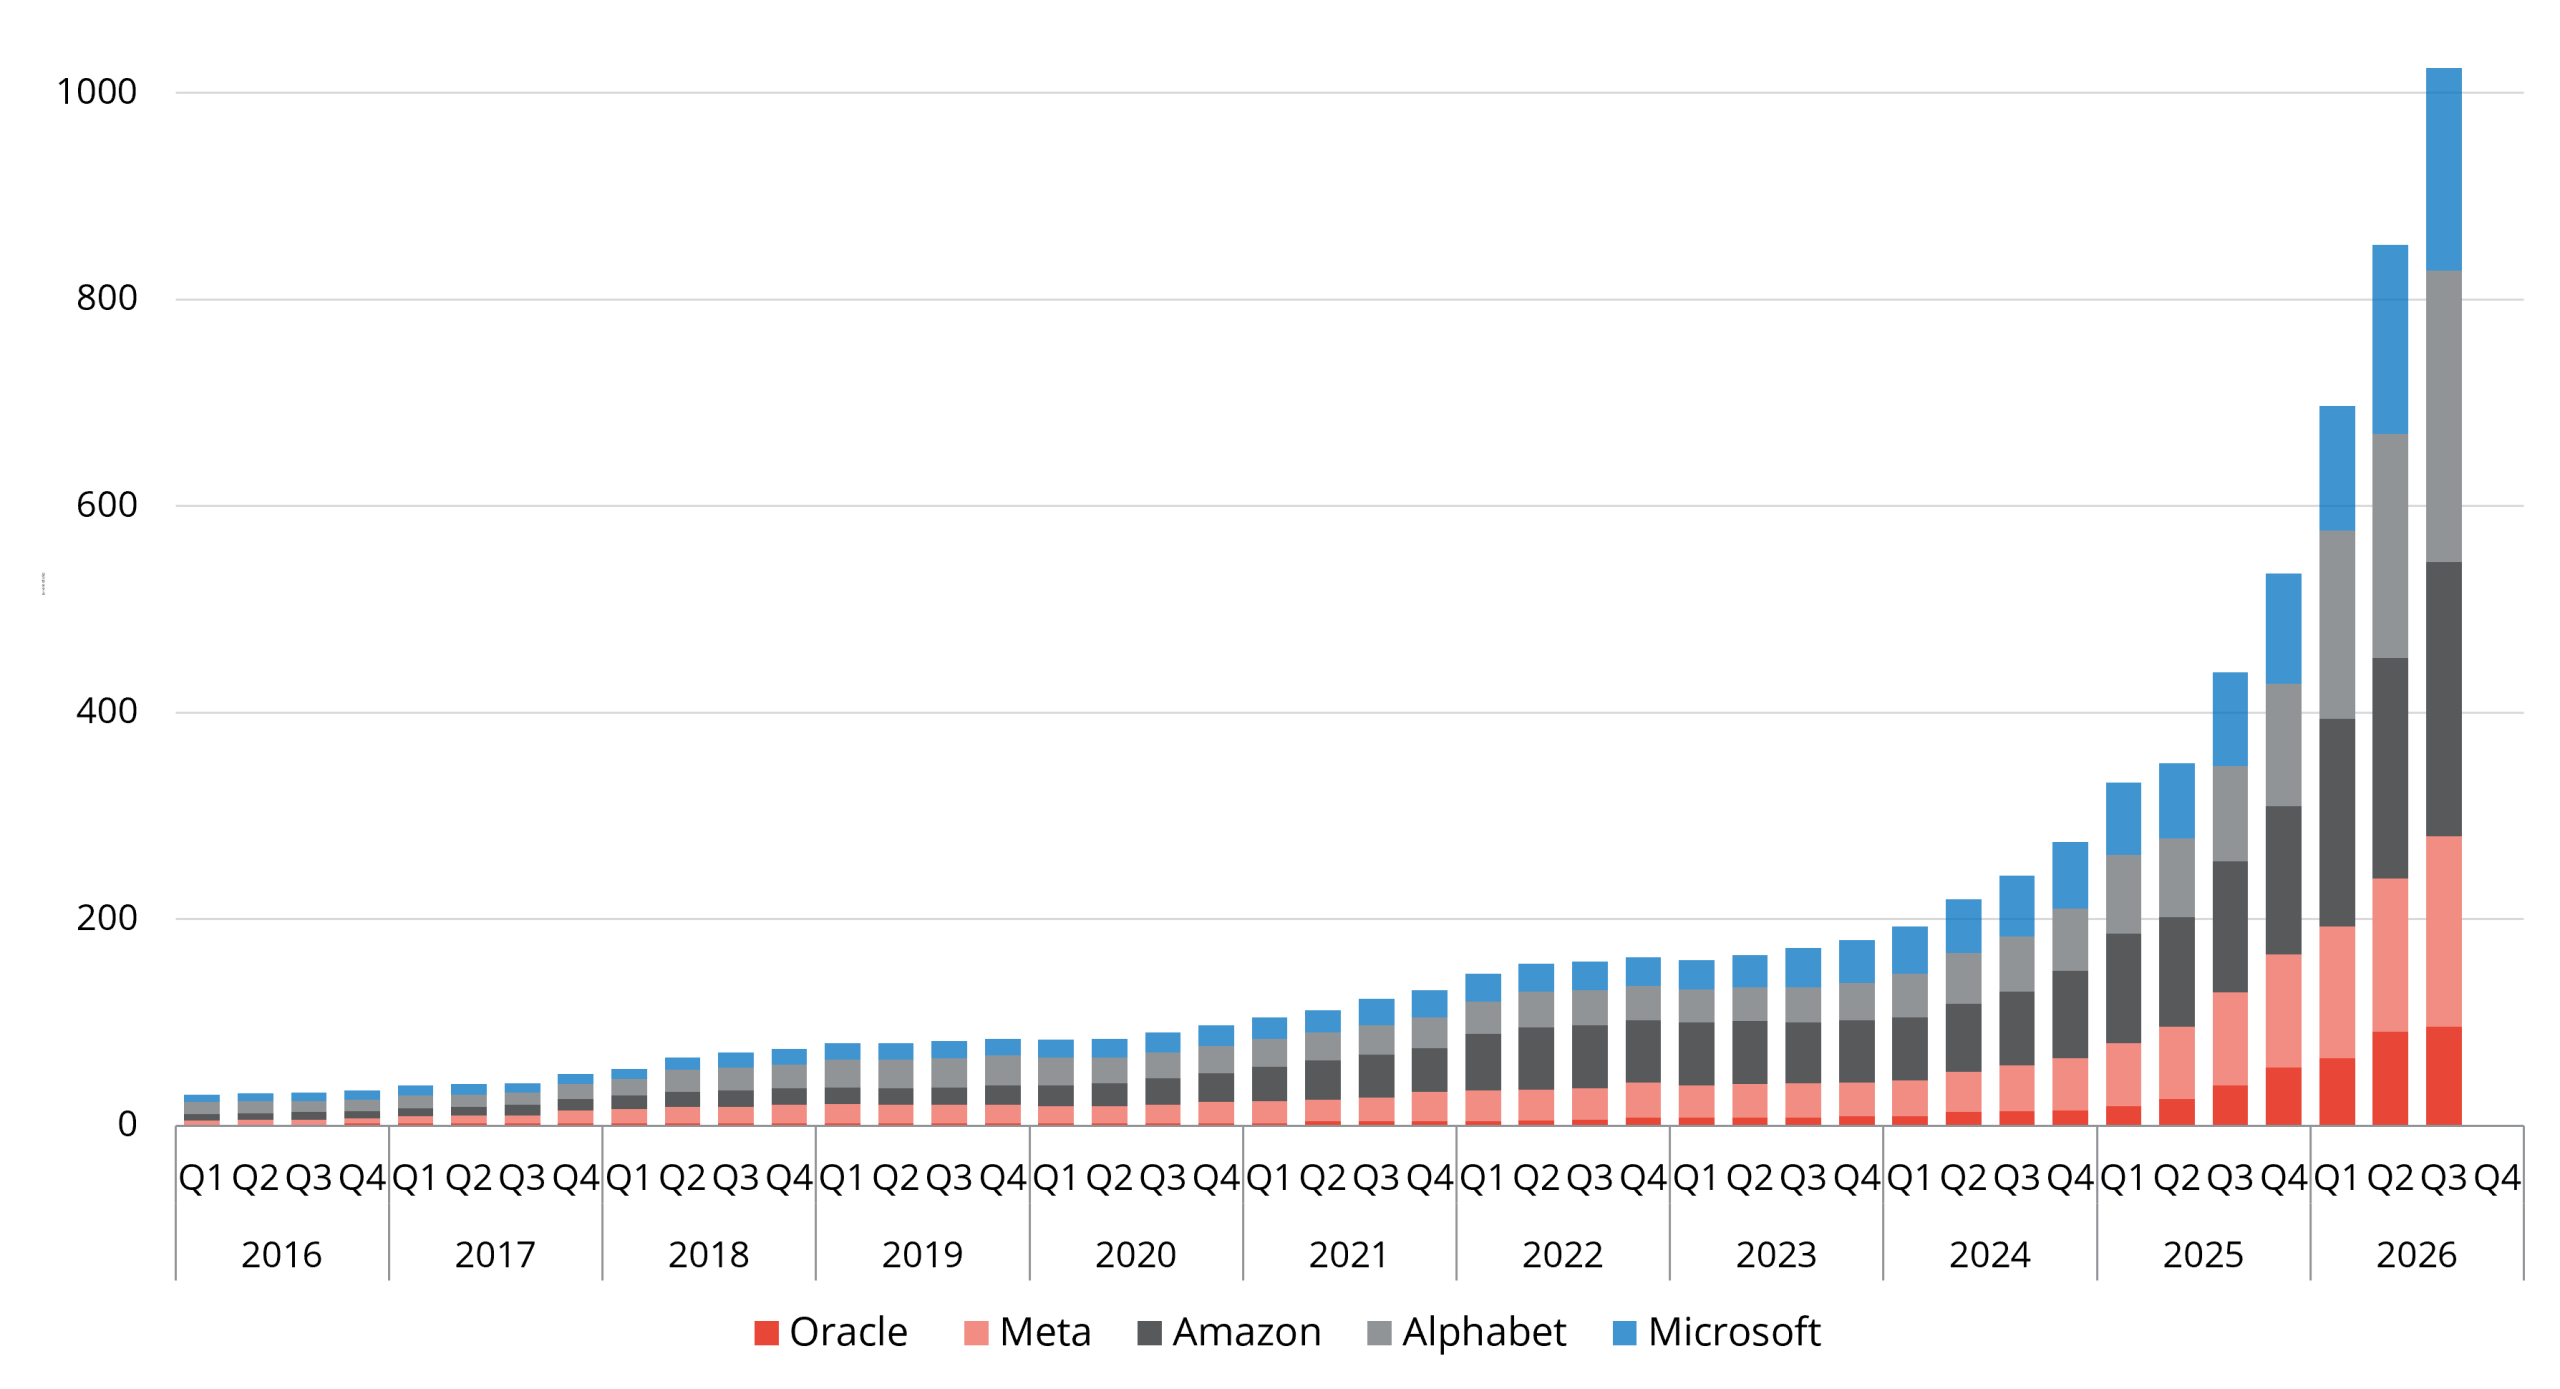
Forward 12-month capital expenditure projections among the leading hyperscalers (Alphabet, Amazon, Microsoft, Meta, and Oracle) continue to swell, with estimates now exceeding collectively. By comparison, these same tech giants deployed only a fraction of this capital five years ago.
Chart 5: Forward 12-month capital expenditure estimates
History offers a chilling reminder: whenever enormous sums of capital are poured into a single thematic infrastructure buildout over a compressed timeframe—whether 19th-century railroads or the dot-com telecom expansion—Has historically tended to be followed by over capacity, fierce price deflation, and depressed shareholder returns.
The combination of sky-high valuations in the US, vanishing cash buffers, and record leverage etc. creates a fragile setup in our view for investors. We believe that it is unlikely that the winners of the past decade will repeat their spell over the next ten years.
In our view, rather than sleepwalking into overvalued, crowded trades, investors may be better placed seeking a diversified approach in portfolios to include a value approach to complement their growth allocations. The Redwheel Global Intrinsic Value Team believe that portfolio resilience comes from owning businesses with robust balance sheets and disciplined valuations that trade at substantial discounts to their intrinsic worth.
To explore several more ‘spooky’ charts with Ian Lance and learn more about the Redwheel Global Intrinsic Value Strategy, access a recording of our recent webinar below.
Key Information
No investment strategy or risk management technique can guarantee returns or eliminate risks in any market environment. Past performance is not a guide to the future. The prices of investments and income from them may fall as well as rise and investors may not get back the full amount invested. Forecasts and estimates are based upon subjective assumptions about circumstances and events that may not yet have taken place and may never do so. The statements and opinions expressed in this article are those of the author as of the date of publication, and do not necessarily represent the view of Redwheel. This article does not constitute investment advice and the information shown is for illustrative purposes only.
The S&P 500 may appear calm – but it’s a different story beneath the surface. John Teahan, Portfolio Manager, Redwheel Value and Income, reveals how low stock-to-index correlation and wide performance dispersion are creating opportunities for stock-pickers. However, capturing them requires skill, freedom and the nerve to be different.
The current ‘super’ El Niño could have sharply contrasting consequences across emerging economies. The Redwheel Emerging and Frontier Markets team explore how it could compound pressures from war and climate change on commodity production and trade, challenging food importers while creating opportunities for some agricultural producers.
Read a recent insight from the Redwheel Emerging and Frontier Markets on MSCI's proposal to reclassify Indonesia.
Redwheel ® and Ecofin ® are registered trademarks of RWC Partners Limited (“RWC”). The term “Redwheel” may include any one or more Redwheel branded regulated entities including RWC Asset Management LLP, which is authorised and regulated by the UK Financial Conduct Authority and the US Securities and Exchange Commission (“SEC”); RWC Asset Advisors (US) LLC, which is registered with the SEC; RWC Singapore (Pte) Limited, which is licensed as a Licensed Fund Management Company by the Monetary Authority of Singapore; Redwheel Australia Pty Ltd is an Australian Financial Services Licensee with the Australian Securities and Investment Commission; and Redwheel Europe Fondsmæglerselskab A/S which is regulated by the Danish Financial Supervisory Authority.
Redwheel may act as investment manager or adviser, or otherwise provide services, to more than one product pursuing a similar investment strategy or focus to the product detailed in this document. Redwheel and RWC (together “Redwheel Group”) seeks to minimise any conflicts of interest, and endeavours to act at all times in accordance with its legal and regulatory obligations as well as its own policies and codes of conduct.
This document is directed only at professional, institutional, wholesale or qualified investors. The services provided by Redwheel are available only to such persons. It is not intended for distribution to and should not be relied on by any person who would qualify as a retail or individual investor in any jurisdiction or for distribution to, or use by, any person or entity in any jurisdiction where such distribution or use would be contrary to local law or regulation.
This document has been prepared for general information purposes only and has not been delivered for registration in any jurisdiction nor has its content been reviewed or approved by any regulatory authority in any jurisdiction.
The information contained herein does not constitute: (i) a binding legal agreement; (ii) legal, regulatory, tax, accounting or other advice; (iii) an offer, recommendation or solicitation to buy or sell shares in any fund, security, commodity, financial instrument or derivative linked to, or otherwise included in a portfolio managed or advised by Redwheel; or (iv) an offer to enter into any other transaction whatsoever (each a “Transaction”). Redwheel Group bears no responsibility for your investment research and/or investment decisions and you should consult your own lawyer, accountant, tax adviser or other professional adviser before entering into any Transaction. No representations and/or warranties are made that the information contained herein is either up to date and/or accurate and is not intended to be used or relied upon by any counterparty, investor or any other third party.
Redwheel Group uses information from third party vendors, such as statistical and other data, that it believes to be reliable. However, the accuracy of this data, which may be used to calculate results or otherwise compile data that finds its way over time into Redwheel Group research data stored on its systems, is not guaranteed. If such information is not accurate, some of the conclusions reached or statements made may be adversely affected. Any opinion expressed herein, which may be subjective in nature, may not be shared by all directors, officers, employees, or representatives of Group and may be subject to change without notice. Redwheel Group is not liable for any decisions made or actions or inactions taken by you or others based on the contents of this document and neither Redwheel Group nor any of its directors, officers, employees, or representatives (including affiliates) accepts any liability whatsoever for any errors and/or omissions or for any direct, indirect, special, incidental, or consequential loss, damages, or expenses of any kind howsoever arising from the use of, or reliance on, any information contained herein.
Information contained in this document should not be viewed as indicative of future results. Past performance of any Transaction is not indicative of future results. The value of investments can go down as well as up. Certain assumptions and forward looking statements may have been made either for modelling purposes, to simplify the presentation and/or calculation of any projections or estimates contained herein and Redwheel Group does not represent that that any such assumptions or statements will reflect actual future events or that all assumptions have been considered or stated. There can be no assurance that estimated returns or projections will be realised or that actual returns or performance results will not materially differ from those estimated herein. Some of the information contained in this document may be aggregated data of Transactions executed by Redwheel that has been compiled so as not to identify the underlying Transactions of any particular customer.
No representations or warranties of any kind are intended or should be inferred with respect to the economic return from, or the tax consequences of, an investment in a Redwheel-managed fund.
This document expresses no views as to the suitability or appropriateness of the fund or any other investments described herein to the individual circumstances of any recipient.
The information transmitted is intended only for the person or entity to which it has been given and may contain confidential and/or privileged material. In accepting receipt of the information transmitted you agree that you and/or your affiliates, partners, directors, officers and employees, as applicable, will keep all information strictly confidential. Any review, retransmission, dissemination or other use of, or taking of any action in reliance upon, this information is prohibited. Any distribution or reproduction of this document is not authorised and is prohibited without the express written consent of Redwheel Group.
Funds managed by Redwheel are not, and will not be, registered under the Securities Act of 1933 (the “Securities Act”) and are not available for purchase by US persons (as defined in Regulation S under the Securities Act) except to persons who are “qualified purchasers” (as defined in the Investment Company Act of 1940) and “accredited investors” (as defined in Rule 501(a) under the Securities Act).
This document does not constitute an offer to sell, purchase, subscribe for or otherwise invest in units or shares of any fund managed by Redwheel. Any offering is made only pursuant to the relevant offering document and the relevant subscription application. Prospective investors should review the offering memorandum in its entirety, including the risk factors in the offering memorandum, before making a decision to invest.
AIFMD and Distribution in the European Economic Area (“EEA”)
The Alternative Fund Managers Directive (Directive 2011/61/EU) (“AIFMD”) is a regulatory regime which came into full effect in the EEA on 22 July 2014. RWC Asset Management LLP is an Alternative Investment Fund Manager (an “AIFM”) to certain funds managed by it (each an “AIF”). The AIFM is required to make available to investors certain prescribed information prior to their investment in an AIF. The majority of the prescribed information is contained in the latest Offering Document of the AIF. The remainder of the prescribed information is contained in the relevant AIF’s annual report and accounts. All of the information is provided in accordance with the AIFMD.
In relation to each member state of the EEA (each a “Member State”), this document may only be distributed and shares in a Redwheel fund (“Shares”) may only be offered and placed to the extent that (a) the relevant Redwheel fund is permitted to be marketed to professional investors in accordance with the AIFMD (as implemented into the local law/regulation of the relevant Member State); or (b) this document may otherwise be lawfully distributed and the Shares may lawfully be offered or placed in that Member State (including at the initiative of the investor).
Information Required for Offering in Switzerland of Foreign Collective Investment Schemes to Qualified Investors within the meaning of Article 10 CISA.
This is an advertising document.
The representative and paying agent of the Redwheel-managed funds in Switzerland (the “Representative in Switzerland”) FIRST INDEPENDENT FUND SERVICES LTD, Feldeggstrasse 12, CH-8008 Zurich. Swiss Paying Agent: Helvetische Bank AG, Seefeldstrasse 215, CH-8008 Zurich. In respect of the units of the Redwheel-managed funds offered in Switzerland, the place of performance is at the registered office of the Swiss Representative. The place of jurisdiction is at the registered office of the Swiss Representative or at the registered office or place of residence of the investor.
No investment strategy or risk management technique can guarantee returns or eliminate risks in any market environment.The term “RWC” may include any one or more RWC branded entities including RWC Partners Limited and RWC Asset Management LLP, each of which is authorised and regulated by the UK Financial Conduct Authority and, in the case of RWC Asset Management LLP, the US Securities and Exchange Commission; RWC Asset Advisors (US) LLC, which is registered with the US Securities and Exchange Commission; and RWC Singapore (Pte) Limited, which is licensed as a Licensed Fund Management Company by the Monetary Authority of Singapore.RWC may act as investment manager or adviser, or otherwise provide services, to more than one product pursuing a similar investment strategy or focus to the product detailed in this audio. RWC seeks to minimise any conflicts of interest, and endeavours to act at all times in accordance with its legal and regulatory obligations as well as its own policies and codes of conduct.This audio is directed only at professional, institutional, wholesale or qualified investors. The services provided by RWC are available only to such persons. It is not intended for distribution to and should not be relied on by any person who would qualify as a retail or individual investor in any jurisdiction or for distribution to, or use by, any person or entity in any jurisdiction where such distribution or use would be contrary to local law or regulation.This audio has been prepared for general information purposes only and has not been delivered for registration in any jurisdiction nor has its content been reviewed or approved by any regulatory authority in any jurisdiction. The information contained herein does not constitute: (i) a binding legal agreement; (ii) legal, regulatory, tax, accounting or other advice; (iii) an offer, recommendation or solicitation to buy or sell shares in any fund, security, commodity, financial instrument or derivative linked to, or otherwise included in a portfolio managed or advised by RWC; or(iv) an offer to enter into any other transaction whatsoever (each a “Transaction”). No representations and/or warranties are made that the information contained herein is either up to date and/or accurate and is not intended to be used or relied upon by any counterparty, investor or any other third party.RWC uses information from third party vendors, such as statistical and other data, that it believes to be reliable. However, the accuracy of this data, which may be used to calculate results or otherwise compile data that finds its way over time into RWC research data stored on its systems, is not guaranteed. If such information is not accurate, some of the conclusions reached or statements made may be adversely affected. RWC bears no responsibility for your investment research and/or investment decisions and you should consult your own lawyer, accountant, tax adviser or other professional adviser before entering into any Transaction. Any opinion expressed herein, which may be subjective in nature, may not be shared by all directors, officers, employees, or representatives of RWC and may be subject to change without notice. RWC is not liable for any decisions made or actions or in actions taken by you or others based on the contents of this audio and neither RWC nor any of its directors, officers, employees, or representatives (including affiliates) accepts any liability whatsoever for any errors and/or omissions or for any direct, indirect, special, incidental, or consequential loss, damages, or expenses of any kind howsoever arising from the use of, or reliance on, any information contained herein.Information contained in this audio should not be viewed as indicative of future results. Past performance of any Transaction is not indicative of future results. The value of investments can go down as well as up. Certain assumptions and forward looking statements may have been made either for modelling purposes, to simplify the audio and/or calculation of any projections or estimates contained herein and RWC does not represent that that any such assumptions or statements will reflect actual future events or that all assumptions have been considered or stated. Forward-looking statements are inherently uncertain, and changing factors such as those affecting the markets generally, or those affecting particular industries or issuers, may cause results to differ from those discussed. Accordingly, there can be no assurance that estimated returns or projections will be realised or that actual returns or performance results will not materially differ from those estimated herein. Some of the information contained in this audio may be aggregated data of Transactions executed by RWC that has been compiled so as not to identify the underlying Transactions of any particular customer.The information transmitted is intended only for the person or entity to which it has been given and may contain confidential and/or privileged material. In accepting receipt of the information transmitted you agree that you and/or your affiliates, partners, directors, officers and employees, as applicable, will keep all information strictly confidential. Any review, retransmission, dissemination or other use of, or taking of any action in reliance upon, this information is prohibited. The information contained herein is confidential and is intended for the exclusive use of the intended recipient(s) to which this audio has been provided. Any distribution or reproduction of this audio is not authorised and is prohibited without the express written consent of RWC or any of its affiliates.Changes in rates of exchange may cause the value of such investments to fluctuate. An investor may not be able to get back the amount invested and the loss on realisation may be very high and could result in a substantial or complete loss of the investment. In addition, an investor who realises their investment in a RWC-managed fund after a short period may not realise the amount originally invested as a result of charges made on the issue and/or redemption of such investment. The value of such interests for the purposes of purchases may differ from their value for the purpose of redemptions. No representations or warranties of any kind are intended or should be inferred with respect to the economic return from, or the tax consequences of, an investment in a RWC-managed fund. Current tax levels and reliefs may change. Depending on individual circumstances, this may affect investment returns. Nothing in this document constitutes advice on the merits of buying or selling a particular investment. This audio expresses no views as to the suitability or appropriateness of the fund or any other investments described herein to the individual circumstances of any recipient.AIFMD and Distribution in the European Economic Area (“EEA”)The Alternative Fund Managers Directive (Directive 2011/61/EU)(“AIFMD”) is a regulatory regime which came into full effect in the EEA on 22 July 2014. RWC Asset Management LLP is an Alternative Investment Fund Manager (an “AIFM”) to certain funds managed by it (each an “AIF”). The AIFM is required to make available to investors certain prescribed information prior to their investment in an AIF. The majority of the prescribed information is contained in the latest Offering Document of the AIF. The remainder of the prescribed information is contained in the relevant AIF’s annual report and accounts. All of the information is provided in accordance with the AIFMD.In relation to each member state of the EEA (each a “Member State”),this document may only be distributed and shares in a RWC fund(“Shares”) may only be offered and placed to the extent that (a) the relevant RWC fund is permitted to be marketed to professional investors in accordance with the AIFMD (as implemented into the local law/regulation of the relevant Member State); or (b) this audio may otherwise be lawfully distributed and the Shares may lawfully offered or placed in that Member State (including at the initiative of the investor).Information Required for Distribution of Foreign Collective Investment Schemes to Qualified Investors in SwitzerlandThe representative and paying agent of the RWC-managed funds in Switzerland (the “Representative in Switzerland”) FIRST INDEPENDENT FUND SERVICES LTD, Klausstrasse 33, CH-8008 Zurich. Swiss Paying Agent: Helvetische Bank AG, Seefeldstrasse 215, CH-8008 Zurich. In respect of the units of the RWC-managed funds distributed in Switzerland, the place of performance and jurisdiction is at the registered office of the Representative in Switzerland.