







Changing of the Guard: Re-shoring to Drive a Manufacturing Resurgence

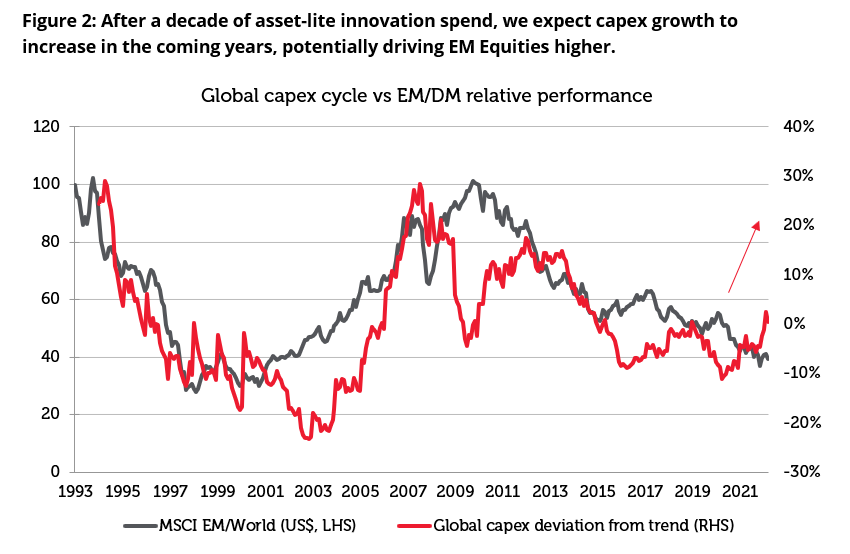
Over the past decade we have seen more investment in asset-light innovation and technology than in any previous business cycle. The world is now awash with food delivery apps and online gaming and video streaming services. This investment has generally been driven by low inflation and a low cost of capital. However, we believe that the world is now entering a new asset-heavy economic cycle characterised by higher inflation, positive real interest rates and increased tangible capex as the world’s priorities shift towards more spending on defence, renewable energy and localised manufacturing supply chains. As the macro environment is changing, we believe that the geopolitical environment is also evolving in a way that is very different to the one that shaped the secular bull market in trade of the 1990s and 2000s.

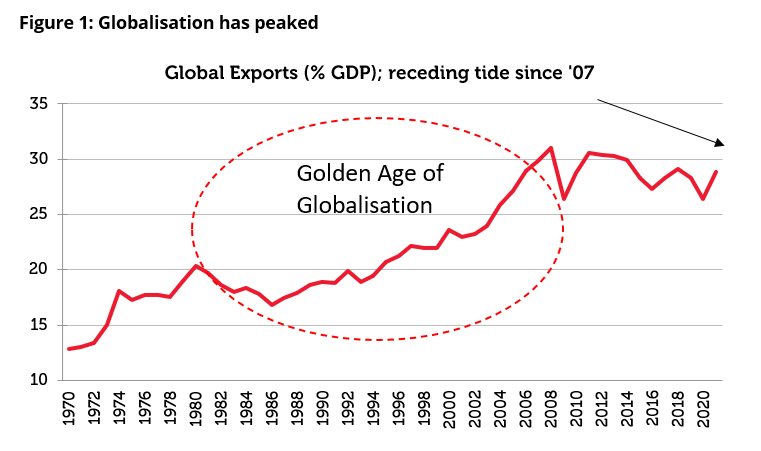
In 1986, the pivotal Uruguay Round of the General Agreement on Tariffs and Trade (GATT) marked the start of a new era of globalisation. World trade expanded rapidly following the collapse of the Berlin Wall in 1989 and the signing of the North American Free Trade Agreement (NAFTA) in 1994. India joined the World Trade Organisation (WTO) in 1995 and China finally gained entry in 2001. Between 1995 and 2010, the pace of world trade grew at twice the rate of world GDP.[1]

The outsourcing of manufacturing to cheap labour regions of the world along with the lower cost of importing capital goods back to the West dramatically boosted world trade. This benefitted countries such as Germany and the US.
Source: World Bank as at 06/03/2023. The information shown above is for illustrative purposes. Past performance is not a guide to future results.

The peak of globalisation coincided with the financial crisis in 2008. Since then, world trade has slowed and trade as a share of GDP has moderated. We expect that this slower trend will continue after the Covid pandemic and the conflict in Ukraine revealed the fragility and over reliance on crucial supply chains in certain countries.

The focus on de-carbonisation and increased geopolitical considerations are likely to result in a move towards greater regionalisation and onshoring which should drive capex growth. We believe that one of the more important aspects of de-globalisation relates to the security vulnerabilities created by potential economic dependence on strategic rivals such as Germany’s reliance on Russia for the majority of its oil supply. As a result, supply chain security is being prioritised over the cost of production. With globalisation leading to deeper global trading relationships, we believe that unwinding these connections will create long-lasting effects on the global economy and financial markets. This will negatively impact developed markets as a more localised production base will likely raise the costs for most corporates in the developed world. On the other hand, Emerging markets (EM) should see a net benefit on the back of Foreign Direct Investment (FDI) inflows into various regions and increasing capex.
Source: Redwheel, CLSA, Datastream – Refinitiv as at 16 March 2023. Past performance is not a guide to future results. The information shown above is for illustrative purposes.
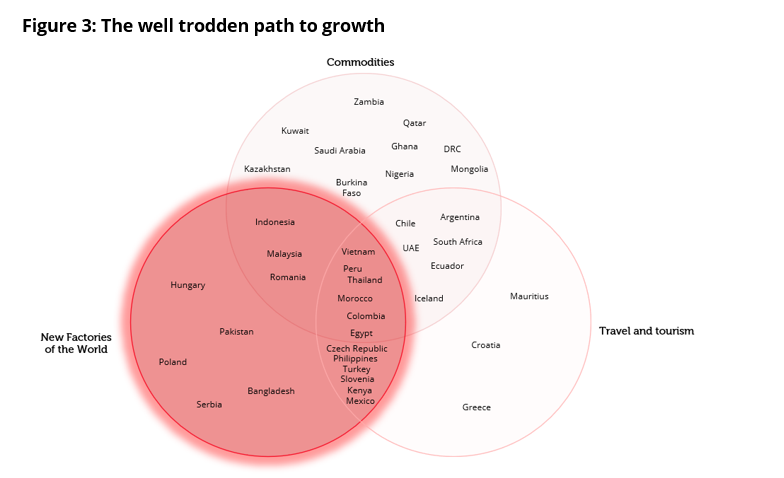
Source: Redwheel as at 28/02/2023. The information shown above is for illustrative purposes.

The Beneficiaries: Next Generation Emerging (NGEN) Markets

One of the most powerful ways that a country can develop its internal resources and realise its true longterm potential is by establishing an urbanised working population. This requires investment in manufacturing capabilities so that the workforce can shift from agrarian roots to a developed, salaried existence. Urbanisation drives consumption as local economies grow and consumers look to increase spending in property and durable goods, such as cars and appliances.

China represents one of the most striking examples of this transformation. Its manufacturing capacity grew exponentially over the last twenty five years and created enough jobs to lift 750 million people out of poverty and into urban life.[2] Over the same time, its share of global manufacturing has risen from approx. 4% in 2000 to nearly 29% today.[3] As the US and Western Europe reduce their dependency on China, we expect this relocation of supply chains to benefit Latin America, Eastern Europe and the ASEAN region in the same way.

The US has shifted its stance towards China and introduced policies that encourage re-shoring as illustrated by the Inflation Reduction Act and the CHIPS Act. Given the size of the Chinese export pie — almost ~US$600 billion p.a. is from the US alone — the emergence of new ecosystems represents a very significant opportunity for Next Generation Emerging Markets.[4] The US, Europe and Japan have remained important FDI sources for Next Generation Emerging Markets (NGEN), contributing significantly to the upswing since 2021. However, FDI from China, Taiwan and Korea has risen strongly with this bloc’s contribution to ASEAN inflows rising the most over the past decade as North Asian markets move up the value chain.
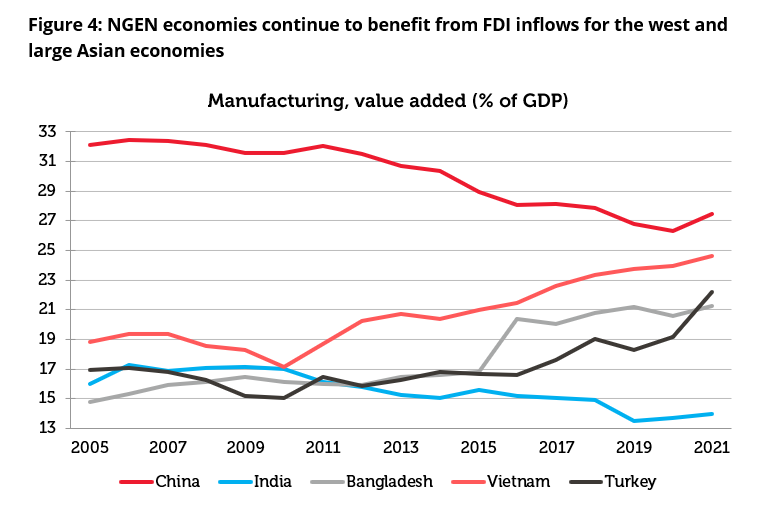
 

Source: World Bank as at 01/03/2023. Past performance is not a guide to future results. The information shown above is for illustrative purposes.

Mexico

Gains from nearshoring could be transformational for Mexico’s economy. Mexico’s manufacturing exports (currently ~40% of GDP) could enter a new era of expansion on the back of accelerated growth in existing manufacturing clusters and the rise of new ecosystems.[5] We estimate that Mexican exports could rise by US$155bn (or more than 10% of GDP) over the next 5 years. This includes gains in well-established sectors, those associated with intra-United States, Mexico and Canada trends (US$38bn) and those specifically related to firming IT hardware and new clusters such as batteries, as well as electric vehicles and parts (US$22bn). Mexico is already taking export and manufacturing share from Asian economies to support the US and Canada, and as a result, macro and regional evidence show that we are well into the expansion of current ecosystems.

There are a several key signposts ahead including progress on United States Mexico Canada Agreement (USMCA) disputes, the outcome of Mexico’s 2024 presidential elections, the transition to Electric Vehicles (EVs) and the impact of the Inflation Reduction Act on the US auto industry.

A great example of this ecosystem expansion is Tesla’s recent announcement to build their new factory in Nuevo León which is one of the northern states of Mexico. The five billion dollar investment will aim to create 6,000 jobs and is the largest single investment in Mexico.[6] Beyond the numbers, this highlights Mexico’s strategic role as the US diversifies away from China and moves away from fossil fuels. There are many direct and indirect beneficiaries from these types of inbound investments, ranging from banks such as Banorte to the industrial parks sector led by the Fibras and Vesta. Supply/demand dynamics in the Mexican industrial space are already tight due to the nearshoring structural shift that is driving a manufacturing boom. Looking forward, we estimate the $155 billion of incremental exports (over a 5Y period) would require at least 13 million square meters (sqm) of incremental industrial space — of which only 2 million sqm is under construction. Hence, Mexico is short at least ~11 million sqm of required Gross Leasable Area (GLA). More broadly, higher construction and manufacturing activity are all positive demand drivers for construction related companies in Mexico like cement stocks.
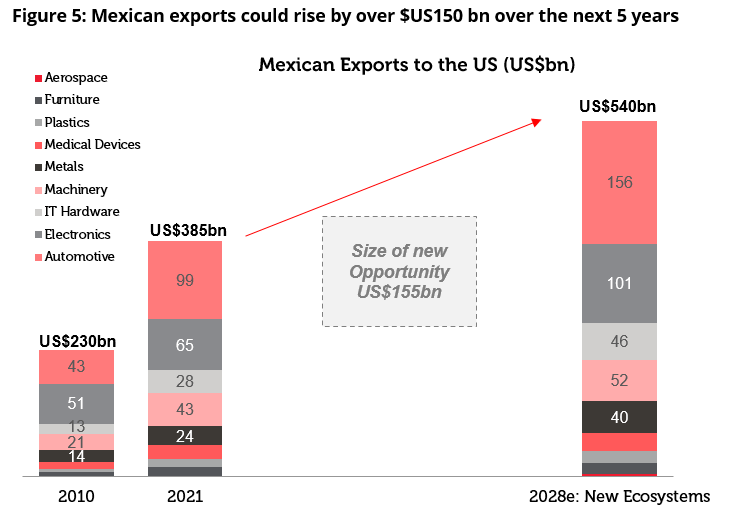
Source: US Census Bureau, Redwheel as at 28/02/2023. Past performance is not a guide to future results. The information shown above is for illustrative purposes.

Vietnam

Vietnam is now an established example of supply chain relocation. As a result of the sustained industrial development in Vietnam over the past decade, Vietnam’s manufacturing output share of GDP has risen from 17% in 2010 to 24% in 2022.[7] Even though Vietnam’s inbound FDI growth has slowed recently the absolute figure is still substantial and has increased as a share of the global aggregate, rising from 0.1% in 2000 to 1.6% in 2020. FDI disbursement in Vietnam also strengthened in 2022.[8] Of all the ASEAN nations Vietnam’s ties to North Asia have deepened the most during the period. By 2018, China and Korea’s value-added contributions to Vietnam’s exports of manufactured goods were 30.7% and 11.7%, respectively.[9]

There seems to be room for capacity growth in Vietnam as its manufacturing output share is still below that of Thailand’s. Moreover, we think Vietnam should continue to gain in areas such as downstream lower-end manufacturing from China given the combination of China’s industrial upgrading and declining working-age population as well as Vietnam’s comparative advantages in these sectors.

Longer term, Vietnam’s strong pursuit of free trade agreements bode well for its ability to move up the value chain. In addition, Vietnam is supported by a relatively large workforce that is young and educated.

Shifts in Asia’s upstream tech supply chain also indicate some of Vietnam’s increased electronic trade flows. As seen on the chart below Vietnam’s share of chip exports from Korea, Taiwan and Japan continues to grow.
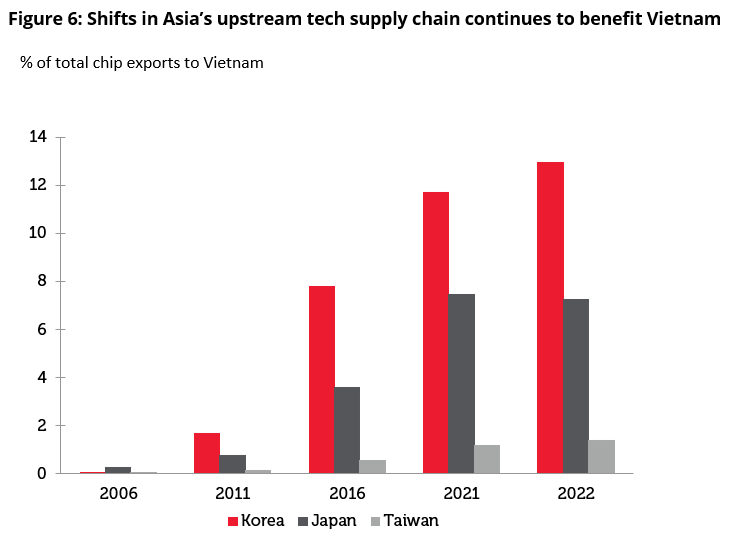
Source: Credit Suisse as at 28/02/2023. Past performance is not a guide to future results. The information shown above is for illustrative purposes.

Over the last decade, Samsung has moved a large portion of its electronics manufacturing from South Korea and China to Vietnam. The company has invested almost $20bn in Vietnam and currently operates six factories along with a research and development centre based in the country. Today, Vietnam accounts for nearly half of Samsung’s mobile phone production globally and in turn Samsung accounts for nearly one fifth of all Vietnam’s exports.[10]

Another example is Apple Macbooks moving production from China to Vietnam with the assistance of its top supplier, Foxconn. The company is moving forward with its plan to eventually end its reliance on China to manufacture many of its products including iPhones, AirPods, HomePods and MacBooks. Production of MacBooks in Vietnam is said to begin as early as May 2023. Once the assembly lines start operations in Vietnam Apple will have a second manufacturing base for its flagship products.

A key beneficiary of this shift to Vietnam is Hoa Phat Group due to the increased demand for infrastructure needed to build out the manufacturing hubs. Hoa Phat Group is the largest steel manufacturer in Vietnam with a market share of around 32.5%.[11] We believe that the improvement in cash flow will reflect in the company’s financials in 2023 and 2024.

Malaysia

Since 2019, Malaysia has experienced the fastest rise in annual FDI inflows as a percentage of GDP in the ASEAN region.[12] The country’s manufacturing output has increased more than that of neighbouring nations during the same period and has pushed up the trade surplus.

Additionally, the increase in FDI likely reflects an expansion of distribution facilities and Malaysia’s increasing role as a trans-shipment hub. Malaysia’s position in the middle of semiconductor supply chains and a comparatively high export overlap with China versus the rest of ASEAN should allow it to gain from regional integration. Additionally, its geographical advantage and increased capacity in global distribution and processing activities lend structural support to boost its manufacturing activity.

We believe that the recent pick-up in FDI can be sustained especially if the new coalition government can provide a more stable political environment than the period following the 2018 election and perceived reputational risks relating to forced labour issues improve.

Going forward, Vietnam and Malaysia look well placed to remain the main ASEAN beneficiaries of supply chain shifts.

Idiosyncratic improvement of Indonesia

Indonesia continues to make inroads in raw material processing. Recent gains reflect the offshoring of basic materials production from China, which could persist as it seeks to achieve carbon neutrality by 2060. Speaking of this trend, FDI inflows from China have jumped since 2016 and now represent the largest source of FDI for Indonesia after Singapore.[13]

Indonesia will likely see continued FDI inflows as part of its venture into the supply chain for decarbonization metals and electric vehicle batteries. We are also optimistic with regarding the outlook for investment into the basic material industries more broadly, given the energy cost and drastic cost escalation of manufacturing in Europe.

Additionally, the government have placed certain restrictions on some of Indonesia’s mining exports, amid increased investment to expand capacity and move further downstream, also point to greater metals value added. Indonesia holds the world’s largest nickel reserves and significant production of this metal and other metals, such as copper, is set to come on stream over the next three to five years. Hence, there is good scope for Indonesia to have an increased role in EV supply chains through providing key battery inputs and potentially production assembly.
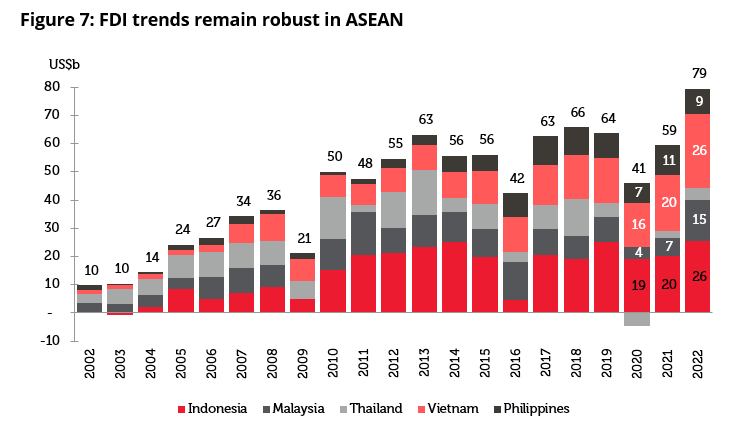
Source: Governments, World Bank, Macquarie Research 28/02/2023. Past performance is not a guide to future results. The information shown above is for illustrative purposes.

Eastern Europe and North Africa

The diversification of supply chains should also benefit countries in Eastern Europe and North Africa. Despite relatively higher labour costs compared to LATAM and ASEAN peers, its geographical proximity to Western Europe, higher quality of production and the shortened delivery times can compensate for the labour-cost gap among these countries. Despite increases in labour costs, labour costs in Central and Eastern Europe (CEE) countries remain around one third of those in Germany.[14]
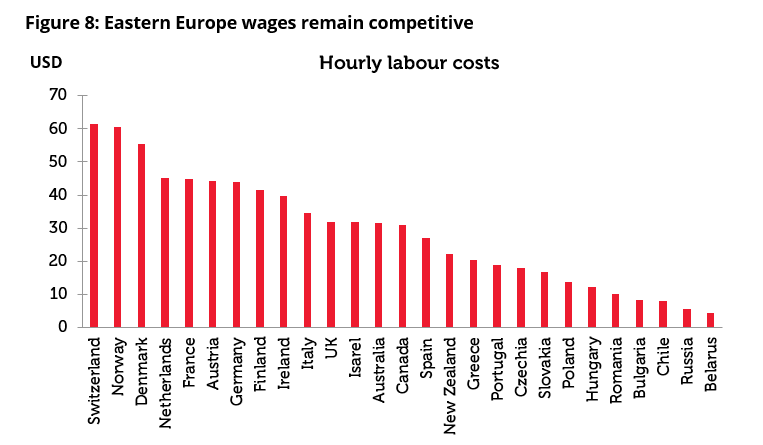
Source: Citi, International Labour Organisation as at 31/12/2022. The information shown above is for illustrative purposes.

*Hourly labour costs in US dollars converted using 2017 purchasing power parities (PPP $) and exchange rates (US $), latest year

In May 2020, the Polish Institute of Economy published a report indicating that the CEE countries could gain up to $22 billion annually following relocation of production from China. The CEE countries that are set to gain the most relatively from this trend are Slovakia, Poland, Czech Republic and Hungary.

The chart below shows a substantial rise in FDI inflows in the CEE region over recent years. Poland stands out as the largest nominal recipient of FDI inflows (though mostly because of the size of its economy). CEE economies are certainly punching above their weight in terms of being an attractive FDI destination. For example, UNCTAD data allows us to estimate that the CEE region accounted for 6% of the value of all announced FDI projects globally in 2021, which is significantly more than the region’s share of global GDP (1.6%) or total population (~1.1%).
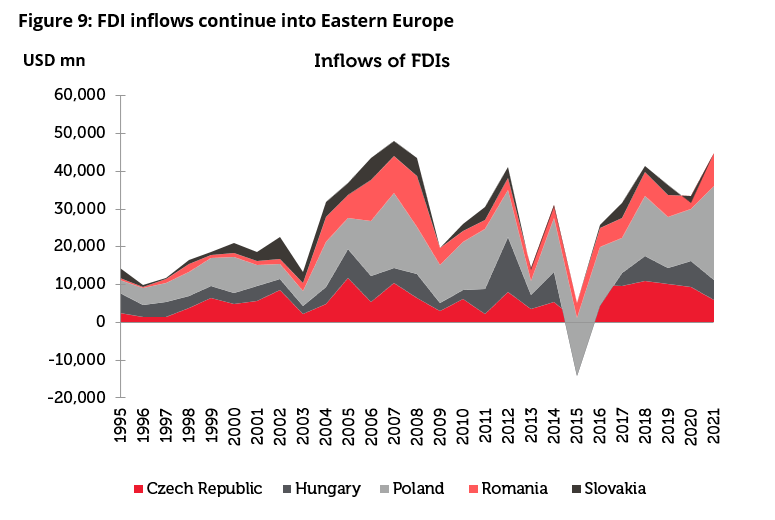
Source: UNCTAD, FDI/MNE database (www.unctad.org/fdistatistics). Past performance is not a guide to future results. The information shown above is for illustrative purposes.

An example of the on-going shift of manufacturing into the CEE region is found in automobile production. Romania, the Czech Republic and Morocco now produce more passenger vehicles than more developed economies, such as Italy. Companies such as Peugeot, Renault and Jaguar Land Rover have all shifted production to lower cost locations, and we expect this trend to continue.

We see the banking sector as the biggest beneficiary in Eastern Europe. There is currently low leverage in the economy meaning that the banks have the capacity to outgrow GDP growth.[15]

Conclusion

The development of a manufacturing economy and an urbanised workforce is a well-trodden path. We have seen it before, and we expect that we will see it again. The Asian “Tiger” economies of Hong Kong, Singapore, South Korea and Thailand enjoyed rapid growth as they developed manufacturing industries and grew employment in the 1980s and 1990s. In the early 2000s, China then took over the helm as the world’s low-cost manufacturer and underwent a similar industrial transformation, growing its manufacturing capacity exponentially.

With the world now looking to diversify its supply chains and to reduce its reliance on China, we believe it will be the next generation emerging market economies which will emerge as the greatest beneficiaries of this new shift in global manufacturing supply chains.

Vietnam is currently among the front-runners of this new wave but other Asian economies such as Malaysia and Indonesia look well-positioned to attract continued inward investment as they develop strong manufacturing bases and expand employment opportunities. Elsewhere in the world, Mexico, the Czech Republic, Morocco and Hungary look similarly well placed to benefit from reshoring over the coming years. Over the last thirty years in emerging markets we have seen the positive effect which higher employment has on a country’s economic development from Korea to China. We now look forward to the Next Generation of Emerging Markets to continue along this well-trodden path to prosperity and economic growth.

Sources: 

[1] World Bank and Bloomberg, as at 30 April 2023 

[2] World Bank & IMF, as at 30 April 2023 

[3] Bloomberg, as at 30 April 2023 

[4] Morgan Stanley, US Census Bureau, 30 April 2023 

[5] Tellimer and WorldBank, 30 April 2023 

[6] Tesla, 30 April 2023 

[7] World Bank, 31 January 2023 

[8] World Bank, 31 January 2023 

[9] World Bank, April 2023 

[10] Samsung Company Reports, 30 April 2023 

[11] Hoa Phat Group Company Reports, 30 April 2023 

[12] World Bank & IMF, 31 Jan 2023 

[13] Credit Suisse, April 2023 

[14] Governments, World Bank, Macquarie Research, April 2023 

[15] Peugeot, Renault, JLR, Company Reports, April 2023 

Key Information
No investment strategy or risk management technique can guarantee returns or eliminate risks in any market environment. Past performance is not a guide to future results. The prices of investments and income from them may fall as well as rise and an investor’s investment is subject to potential loss, in whole or in part. Forecasts and estimates are based upon subjective assumptions about circumstances and events that may not yet have taken place and may never do so. The statements and opinions expressed in this article are those of the author as of the date of publication, and do not necessarily represent the view of Redwheel. This article does not constitute investment advice and the information shown is for illustrative purposes only.

In case you missed it

Emerging & Frontier Markets

The ‘Fab 4’ become the ‘FOMO 3’

The Redwheel Emerging and Frontier Markets team explores the concentration challenge facing investors today and maps out under‑owned countries, sectors and themes that the team believes offer a richer blend of structural growth and genuine diversification.

27 July, 2026 | 01:48pm
UK Value & income

When it rhymes it pours

Shaul Rosten, Analyst with the Redwheel Value and Income team looks at the striking similarities between today’s market exuberance and the dotcom era, highlighting stretched valuations, record IPO activity and the dominance of the technology sector.

20 July, 2026 | 07:58pm
UK Value & income

Two beautiful games

As England’s World Cup campaign unfolds, the tournament provides a vivid reminder that sensible bets are grounded in probabilities. Supporters know that backing long-shot teams is unlikely to be rewarded, while favouring stronger sides with clear track records is more prudent. In his latest blog, Shaul Rosten of Redwheel's Value & Income team examines how value investing adopts a similar stance, focusing on quality businesses at attractive valuations, rather than richly priced growth narratives with low odds of delivery.

6 July, 2026 | 07:29pm

Disclaimer

Redwheel ® and Ecofin ® are registered trademarks of RWC Partners Limited (“RWC”). The term “Redwheel” may include any one or more Redwheel branded regulated entities including RWC Asset Management LLP, which is authorised and regulated by the UK Financial Conduct Authority and the US Securities and Exchange Commission (“SEC”); RWC Asset Advisors (US) LLC, which is registered with the SEC;  RWC Singapore (Pte) Limited, which is licensed as a Licensed Fund Management Company by the Monetary Authority of Singapore; Redwheel Australia Pty Ltd is an Australian Financial Services Licensee with the Australian Securities and Investment Commission; and Redwheel Europe Fondsmæglerselskab A/S which is regulated by the Danish Financial Supervisory Authority.

Redwheel may act as investment manager or adviser, or otherwise provide services, to more than one product pursuing a similar investment strategy or focus to the product detailed in this document. Redwheel and RWC (together “Redwheel Group”) seeks to minimise any conflicts of interest, and endeavours to act at all times in accordance with its legal and regulatory obligations as well as its own policies and codes of conduct.

This document is directed only at professional, institutional, wholesale or qualified investors. The services provided by Redwheel are available only to such persons. It is not intended for distribution to and should not be relied on by any person who would qualify as a retail or individual investor in any jurisdiction or for distribution to, or use by, any person or entity in any jurisdiction where such distribution or use would be contrary to local law or regulation.

This document has been prepared for general information purposes only and has not been delivered for registration in any jurisdiction nor has its content been reviewed or approved by any regulatory authority in any jurisdiction.

The information contained herein does not constitute: (i) a binding legal agreement; (ii) legal, regulatory, tax, accounting or other advice; (iii) an offer, recommendation or solicitation to buy or sell shares in any fund, security, commodity, financial instrument or derivative linked to, or otherwise included in a portfolio managed or advised by Redwheel; or (iv) an offer to enter into any other transaction whatsoever (each a “Transaction”). Redwheel Group bears no responsibility for your investment research and/or investment decisions and you should consult your own lawyer, accountant, tax adviser or other professional adviser before entering into any Transaction. No representations and/or warranties are made that the information contained herein is either up to date and/or accurate and is not intended to be used or relied upon by any counterparty, investor or any other third party.

Redwheel Group uses information from third party vendors, such as statistical and other data, that it believes to be reliable. However, the accuracy of this data, which may be used to calculate results or otherwise compile data that finds its way over time into Redwheel Group research data stored on its systems, is not guaranteed. If such information is not accurate, some of the conclusions reached or statements made may be adversely affected. Any opinion expressed herein, which may be subjective in nature, may not be shared by all directors, officers, employees, or representatives of Group and may be subject to change without notice. Redwheel Group is not liable for any decisions made or actions or inactions taken by you or others based on the contents of this document and neither Redwheel Group nor any of its directors, officers, employees, or representatives (including affiliates) accepts any liability whatsoever for any errors and/or omissions or for any direct, indirect, special, incidental, or consequential loss, damages, or expenses of any kind howsoever arising from the use of, or reliance on, any information contained herein.

Information contained in this document should not be viewed as indicative of future results. Past performance of any Transaction is not indicative of future results. The value of investments can go down as well as up. Certain assumptions and forward looking statements may have been made either for modelling purposes, to simplify the presentation and/or calculation of any projections or estimates contained herein and Redwheel Group does not represent that that any such assumptions or statements will reflect actual future events or that all assumptions have been considered or stated. There can be no assurance that estimated returns or projections will be realised or that actual returns or performance results will not materially differ from those estimated herein. Some of the information contained in this document may be aggregated data of Transactions executed by Redwheel that has been compiled so as not to identify the underlying Transactions of any particular customer.

No representations or warranties of any kind are intended or should be inferred with respect to the economic return from, or the tax consequences of, an investment in a Redwheel-managed fund.

This document expresses no views as to the suitability or appropriateness of the fund or any other investments described herein to the individual circumstances of any recipient.

The information transmitted is intended only for the person or entity to which it has been given and may contain confidential and/or privileged material. In accepting receipt of the information transmitted you agree that you and/or your affiliates, partners, directors, officers and employees, as applicable, will keep all information strictly confidential. Any review, retransmission, dissemination or other use of, or taking of any action in reliance upon, this information is prohibited. Any distribution or reproduction of this document is not authorised and is prohibited without the express written consent of Redwheel Group.

Funds managed by Redwheel are not, and will not be, registered under the Securities Act of 1933 (the “Securities Act”) and are not available for purchase by US persons (as defined in Regulation S under the Securities Act) except to persons who are “qualified purchasers” (as defined in the Investment Company Act of 1940) and “accredited investors” (as defined in Rule 501(a) under the Securities Act).

This document does not constitute an offer to sell, purchase, subscribe for or otherwise invest in units or shares of any fund managed by Redwheel. Any offering is made only pursuant to the relevant offering document and the relevant subscription application. Prospective investors should review the offering memorandum in its entirety, including the risk factors in the offering memorandum, before making a decision to invest.

AIFMD and Distribution in the European Economic Area (“EEA”)

The Alternative Fund Managers Directive (Directive 2011/61/EU) (“AIFMD”) is a regulatory regime which came into full effect in the EEA on 22 July 2014. RWC Asset Management LLP is an Alternative Investment Fund Manager (an “AIFM”) to certain funds managed by it (each an “AIF”). The AIFM is required to make available to investors certain prescribed information prior to their investment in an AIF. The majority of the prescribed information is contained in the latest Offering Document of the AIF. The remainder of the prescribed information is contained in the relevant AIF’s annual report and accounts. All of the information is provided in accordance with the AIFMD.

In relation to each member state of the EEA (each a “Member State”), this document may only be distributed and shares in a Redwheel fund (“Shares”) may only be offered and placed to the extent that (a) the relevant Redwheel fund is permitted to be marketed to professional investors in accordance with the AIFMD (as implemented into the local law/regulation of the relevant Member State); or (b) this document may otherwise be lawfully distributed and the Shares may lawfully be offered or placed in that Member State (including at the initiative of the investor).

Information Required for Offering in Switzerland of Foreign Collective Investment Schemes to Qualified Investors within the meaning of Article 10 CISA.

This is an advertising document.

The representative and paying agent of the Redwheel-managed funds in Switzerland (the “Representative in Switzerland”) FIRST INDEPENDENT FUND SERVICES LTD, Feldeggstrasse 12, CH-8008 Zurich. Swiss Paying Agent: Helvetische Bank AG, Seefeldstrasse 215, CH-8008 Zurich. In respect of the units of the Redwheel-managed funds offered in Switzerland, the place of performance is at the registered office of the Swiss Representative. The place of jurisdiction is at the registered office of the Swiss Representative or at the registered office or place of residence of the investor.

No investment strategy or risk management technique can guarantee returns or eliminate risks in any market environment.The term “RWC” may include any one or more RWC branded entities including RWC Partners Limited and RWC Asset Management LLP, each of which is authorised and regulated by the UK Financial Conduct Authority and, in the case of RWC Asset Management LLP, the US Securities and Exchange Commission; RWC Asset Advisors (US) LLC, which is registered with the US Securities and Exchange Commission; and RWC Singapore (Pte) Limited, which is licensed as a Licensed Fund Management Company by the Monetary Authority of Singapore.RWC may act as investment manager or adviser, or otherwise provide services, to more than one product pursuing a similar investment strategy or focus to the product detailed in this audio. RWC seeks to minimise any conflicts of interest, and endeavours to act at all times in accordance with its legal and regulatory obligations as well as its own policies and codes of conduct.This audio is directed only at professional, institutional, wholesale or qualified investors. The services provided by RWC are available only to such persons. It is not intended for distribution to and should not be relied on by any person who would qualify as a retail or individual investor in any jurisdiction or for distribution to, or use by, any person or entity in any jurisdiction where such distribution or use would be contrary to local law or regulation.This audio has been prepared for general information purposes only and has not been delivered for registration in any jurisdiction nor has its content been reviewed or approved by any regulatory authority in any jurisdiction. The information contained herein does not constitute: (i) a binding legal agreement; (ii) legal, regulatory, tax, accounting or other advice; (iii) an offer, recommendation or solicitation to buy or sell shares in any fund, security, commodity, financial instrument or derivative linked to, or otherwise included in a portfolio managed or advised by RWC; or(iv) an offer to enter into any other transaction whatsoever (each a “Transaction”). No representations and/or warranties are made that the information contained herein is either up to date and/or accurate and is not intended to be used or relied upon by any counterparty, investor or any other third party.RWC uses information from third party vendors, such as statistical and other data, that it believes to be reliable. However, the accuracy of this data, which may be used to calculate results or otherwise compile data that finds its way over time into RWC research data stored on its systems, is not guaranteed. If such information is not accurate, some of the conclusions reached or statements made may be adversely affected. RWC bears no responsibility for your investment research and/or investment decisions and you should consult your own lawyer, accountant, tax adviser or other professional adviser before entering into any Transaction. Any opinion expressed herein, which may be subjective in nature, may not be shared by all directors, officers, employees, or representatives of RWC and may be subject to change without notice. RWC is not liable for any decisions made or actions or in actions taken by you or others based on the contents of this audio and neither RWC nor any of its directors, officers, employees, or representatives (including affiliates) accepts any liability whatsoever for any errors and/or omissions or for any direct, indirect, special, incidental, or consequential loss, damages, or expenses of any kind howsoever arising from the use of, or reliance on, any information contained herein.Information contained in this audio should not be viewed as indicative of future results. Past performance of any Transaction is not indicative of future results. The value of investments can go down as well as up. Certain assumptions and forward looking statements may have been made either for modelling purposes, to simplify the audio and/or calculation of any projections or estimates contained herein and RWC does not represent that that any such assumptions or statements will reflect actual future events or that all assumptions have been considered or stated. Forward-looking statements are inherently uncertain, and changing factors such as those affecting the markets generally, or those affecting particular industries or issuers, may cause results to differ from those discussed. Accordingly, there can be no assurance that estimated returns or projections will be realised or that actual returns or performance results will not materially differ from those estimated herein. Some of the information contained in this audio may be aggregated data of Transactions executed by RWC that has been compiled so as not to identify the underlying Transactions of any particular customer.The information transmitted is intended only for the person or entity to which it has been given and may contain confidential and/or privileged material. In accepting receipt of the information transmitted you agree that you and/or your affiliates, partners, directors, officers and employees, as applicable, will keep all information strictly confidential. Any review, retransmission, dissemination or other use of, or taking of any action in reliance upon, this information is prohibited. The information contained herein is confidential and is intended for the exclusive use of the intended recipient(s) to which this audio has been provided. Any distribution or reproduction of this audio is not authorised and is prohibited without the express written consent of RWC or any of its affiliates.Changes in rates of exchange may cause the value of such investments to fluctuate. An investor may not be able to get back the amount invested and the loss on realisation may be very high and could result in a substantial or complete loss of the investment. In addition, an investor who realises their investment in a RWC-managed fund after a short period may not realise the amount originally invested as a result of charges made on the issue and/or redemption of such investment. The value of such interests for the purposes of purchases may differ from their value for the purpose of redemptions. No representations or warranties of any kind are intended or should be inferred with respect to the economic return from, or the tax consequences of, an investment in a RWC-managed fund. Current tax levels and reliefs may change. Depending on individual circumstances, this may affect investment returns. Nothing in this document constitutes advice on the merits of buying or selling a particular investment. This audio expresses no views as to the suitability or appropriateness of the fund or any other investments described herein to the individual circumstances of any recipient.AIFMD and Distribution in the European Economic Area (“EEA”)The Alternative Fund Managers Directive (Directive 2011/61/EU)(“AIFMD”) is a regulatory regime which came into full effect in the EEA on 22 July 2014. RWC Asset Management LLP is an Alternative Investment Fund Manager (an “AIFM”) to certain funds managed by it (each an “AIF”). The AIFM is required to make available to investors certain prescribed information prior to their investment in an AIF. The majority of the prescribed information is contained in the latest Offering Document of the AIF. The remainder of the prescribed information is contained in the relevant AIF’s annual report and accounts. All of the information is provided in accordance with the AIFMD.In relation to each member state of the EEA (each a “Member State”),this document may only be distributed and shares in a RWC fund(“Shares”) may only be offered and placed to the extent that (a) the relevant RWC fund is permitted to be marketed to professional investors in accordance with the AIFMD (as implemented into the local law/regulation of the relevant Member State); or (b) this audio may otherwise be lawfully distributed and the Shares may lawfully offered or placed in that Member State (including at the initiative of the investor).Information Required for Distribution of Foreign Collective Investment Schemes to Qualified Investors in SwitzerlandThe representative and paying agent of the RWC-managed funds in Switzerland (the “Representative in Switzerland”) FIRST INDEPENDENT FUND SERVICES LTD, Klausstrasse 33, CH-8008 Zurich. Swiss Paying Agent: Helvetische Bank AG, Seefeldstrasse 215, CH-8008 Zurich. In respect of the units of the RWC-managed funds distributed in Switzerland, the place of performance and jurisdiction is at the registered office of the Representative in Switzerland.