When measured by the standard 20% recovery from a bear market, [1] the MSCI Frontier Markets Index began its bull market run in 2023. From 31 May 2023 to 31 May 2025, the index has gained 35.7%, which equates to 16.5% per annum. Investors might not have noticed the impressive performance of this small and overlooked asset class because the price index has not regained the prior peak. However, the total return index has recaptured the highs of 2008, driven by a powerful combination of structural, economic and market factors that we believe will support a continued rerating.
Chart 1: MSCI Frontier Markets: Price vs Total Return indices
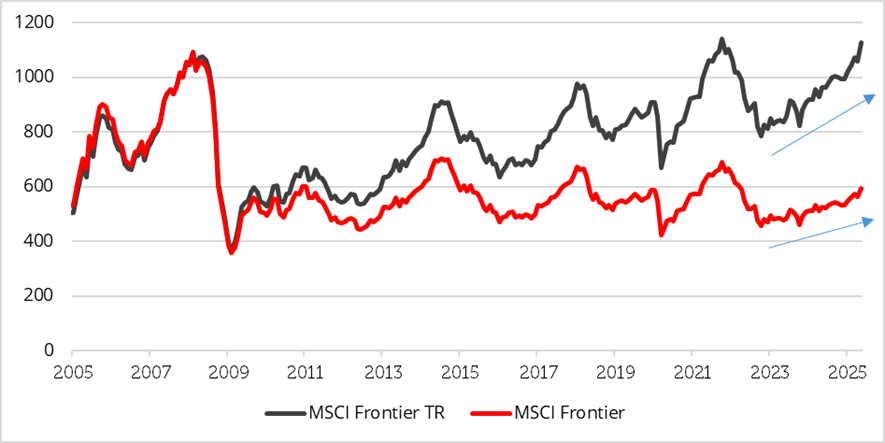
The widening gap between the two series indicates the importance of dividends to total returns, and the MSCI Frontier Markets Index currently has a yield of 6%, the highest of any regional equity index [2]. Such a high yield demonstrates the deep value of frontier markets, many of which have a dividend yield that is higher than their Price / Earnings ratio. This is a rare occurrence in equity markets and denotes unusually cheap valuations.

It’s not just dividends; earnings and ROE are going up
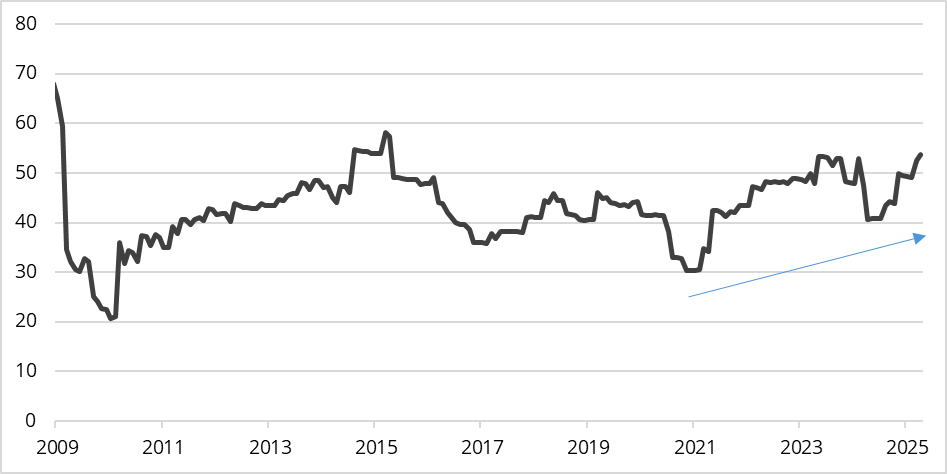
MSCI Frontier Markets Index earnings have recovered from the dip related to COVID-19 and are approaching post-GFC 2008 highs.
Chart 2: Frontier Markets Index EPS (USD)
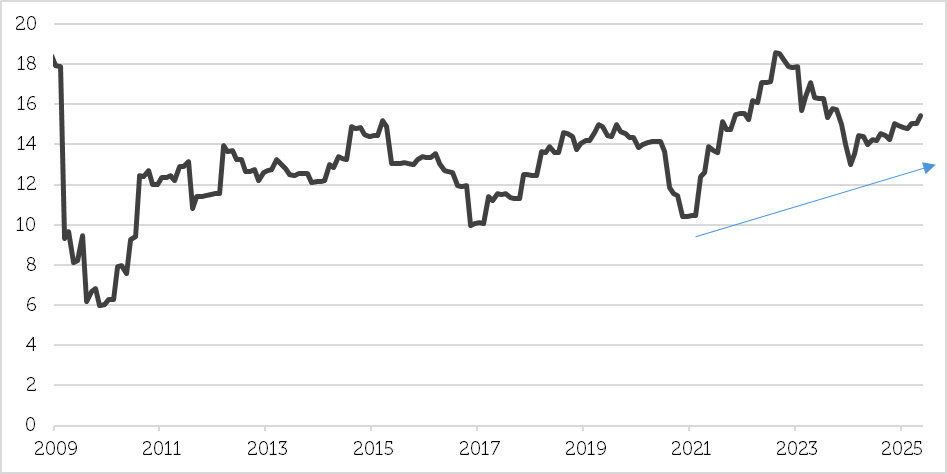
Consequently, profitability has also rebounded strongly, with ROE exceeding 15%.
Chart 3: Frontier Markets Index ROE (%)
Valuation is cheap
Despite the upward trend in earnings and ROE since the COVID-19 pandemic, the valuation of frontier market equities is very cheap with a multiple of only 9 times forward earnings.
Chart 4: Frontier Markets Index P/E
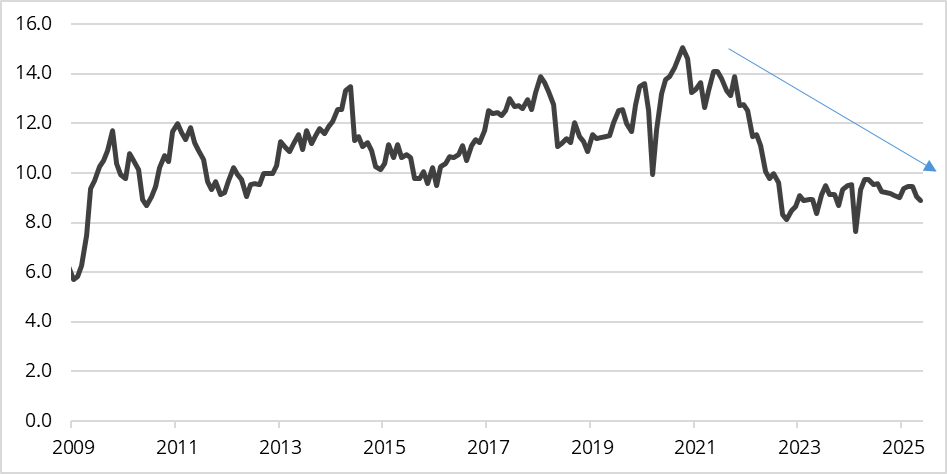
It is noteworthy that the MSCI Frontier Market Index derated significantly from a teen multiple of earnings during COVID to a single digit multiple today, even though both earnings and ROE have improved by approximately 40% since the end of 2020 . This recent low valuation has only previously been apparent during the Global Financial Crisis of 2008 – 2009 (GFC), when both earnings and profitability were greatly depressed in comparison with the levels of today; valuations were higher even during the COVID-19 pandemic. This suggests that frontier markets could be due for a rerating at least towards the long-term average of 10.8 times forward earnings.
Currencies are depressed as well
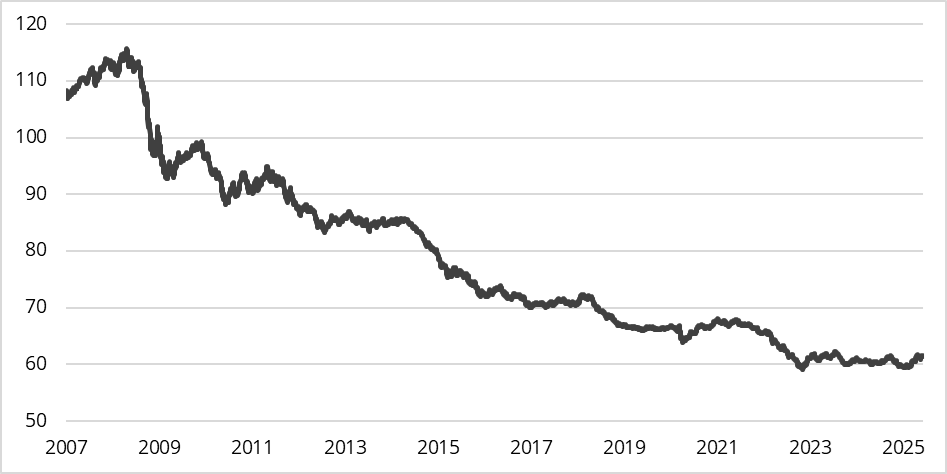
One of the potential sources of return that frontier markets offer value-orientated investors is currency appreciation; currencies have depreciated by nearly 50% against the USD since the GFC, but the dollar is now weakening [3]. This provides a further potential boost for equity investors. Frontier market currencies reached their nadir in 2024 and have begun to recover in 2025. We believe that this trend of currency losses could be reversed as reforms and restructuring progress and portfolio investors diversify out of the USD. A basket of frontier market currencies has climbed by just over 3% for the year to 31st May 2025.
Chart 5: Frontier Market Currency Index v USD
There are, in summary, several sources of possible outperformance in frontier markets: low valuations, high dividend yields, positive earnings growth, accelerating ROE and currency appreciation against the USD catalyzed by economic reforms.
Catalysts for a rerating – reform and restructuring
The first catalyst for higher valuations is economic and financial reform and restructuring in countries that have suffered currency devaluations and debt restructurings because of the rapid rise in interest rates between 2022 and 2023, when the Fed Funds rate rose from just over 0% to just under 5.5% [4]. Argentina, Bangladesh, Egypt, Kenya, Nigeria, Pakistan, Sri Lanka and Turkey have all suffered comparable economic emergencies to the emerging markets that were affected by the Tequila Crisis of 1994 and the Asia Crisis of 1997 – 1998.
In many cases, the IMF has provided financial support in exchange for orthodox economic programmes consisting of balanced budgets, the removal of price controls and subsidies, privatizations and trade liberalization. The IMF also encourages the free movement of capital to persuade foreign investors to take advantage of depressed currencies and commit capital to spur growth, leading to increased levels of foreign direct and portfolio investment. Successful reforms help lower the cost of capital, boost investment and restore growth. Argentina is the best example of a country that has benefited from successful economic restructuring under President Milei.
Chart 6: MSCI Argentina Index
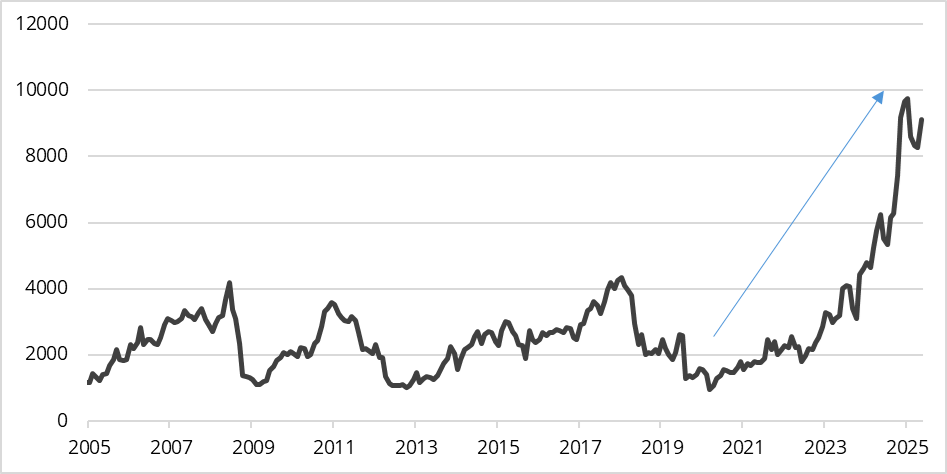
From its low point in March 2020, the MSCI Argentina Index has risen over ninefold for a CAGR of 60.3% per annum to the end of May 2025.
Catalysts for a rerating – rotation from US to international equity markets
Since President Trump took office in January 2025, the US equity market has underperformed international markets as the USD has declined against foreign currencies.

The turn in relative performance started with the imposition of trade tariffs, which may harm the US economically more than the countries from which it imports. In addition, the passage of the “One Big Beautiful Bill” Act prompted Moody’s to downgrade the credit rating of the US as it will enlarge America’s high fiscal deficit and increase the burden of debt / GDP. Section 899 of the bill also threatens additional taxes on foreign entities that might discourage them from investing in the US, all of which encourage diversification away from US assets. Furthermore, the US equity market is valued at a significant premium to international markets, adding further impetus to the hunt for cheaper and possibly less risky foreign markets.
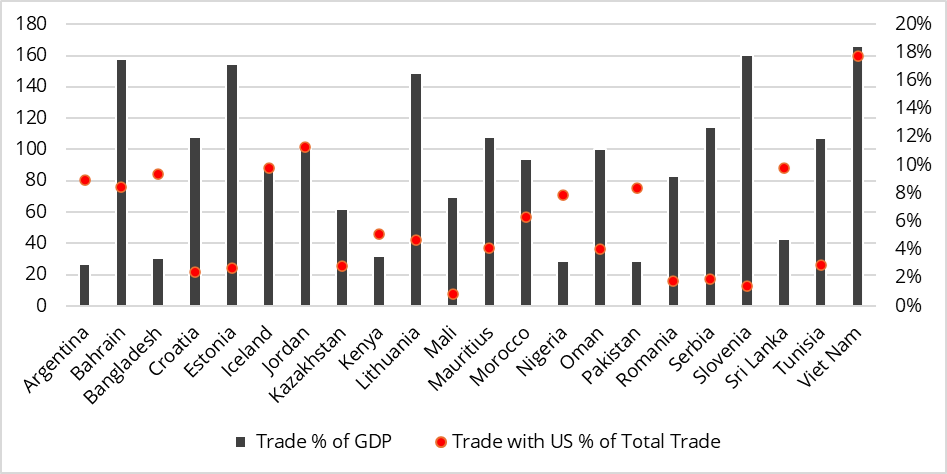
The countries most at risk from duties on imports are those with a high percentage of exports to the US. Although EU member states and Vietnam stand out as being potentially vulnerable to high American import duties, to date levies across frontier markets broadly are still relatively low at 10%. Nevertheless, uncertainty remains over the level of tariffs that might ultimately be imposed.
Chart 7: Trade as % of GDP v % trade with US
Three established paths to growth
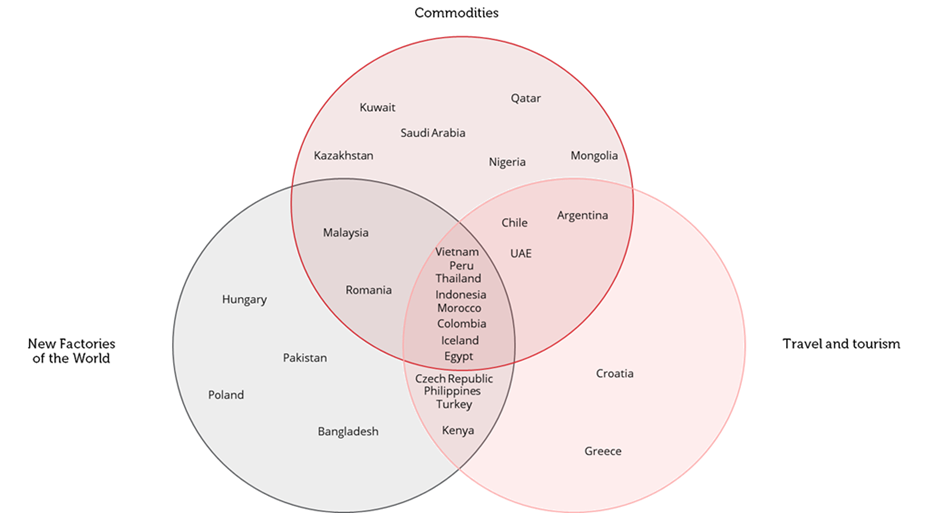
The case for investing in frontier market equities is enhanced by three well-established economic development paths. First, frontier countries are often central to global commodity production due to their abundant natural resources. Sustained demand for the commodities they produce will continue to drive economic growth across these markets. Second, frontier economies are emerging as the new factories of the world amid the evolving manufacturing landscape. Supportive demographic trends and cost advantages are expected to accelerate industrial growth in these markets. Third, developing travel and tourism infrastructure should enable unexplored frontier countries to capture a growing share of international travel demand. This expansion will support local tourism businesses and simultaneously fuel broader economic development. We believe that these three powerful trends position frontier market equities as a compelling opportunity for investors seeking access to dynamic growth and diversification.
Chart 8: Pathways to growth by market
Attractive diversification benefits
The final overlooked attraction of frontier markets is their low correlation to other equity indices; the MSCI Frontier Market Index exhibits the lowest correlation to all other regional MSCI indices, enhancing diversification within a global equity portfolio.

Sources:
[2] Bloomberg, 31 May 2025
[3] Bloomberg, 31 May 2025
[4] Bloomberg, Redwheel
Key Information
No investment strategy or risk management technique can guarantee returns or eliminate risks in any market environment. Past performance is not a guide to the future. The prices of investments and income from them may fall as well as rise and investors may not get back the full amount invested. Forecasts and estimates are based upon subjective assumptions about circumstances and events that may not yet have taken place and may never do so. The statements and opinions expressed in this article are those of the author as of the date of publication, and do not necessarily represent the view of Redwheel. This article does not constitute investment advice and the information shown is for illustrative purposes only.


