









Convertible bonds provide a hybrid solution for investors looking for a balanced exposure to financial markets that combines the attractive elements of both equities and bonds. They aim to deliver upside participation in rising markets while helping protect capital during downturns.
Emerging & Frontier Markets strategies focus on capturing high-growth opportunities across the world’s fastest-growing economies. With a long-standing, index-agnostic approach, the team invests both directly in these markets and in developed market companies with significant exposure to them.
By harnessing the power of dividends, our team aims to deliver a combination of income and long-term capital growth by investing in a diversified portfolio of global equities. The strategy is designed for investors seeking a disciplined approach, targeting a rare combination of premium yield, durable income, and attractive valuation, while selectively investing in overlooked opportunities where short-term controversies have created potential mispricing
Redwheel’s Global Intrinsic Value team is led by Ian Lance and Nick Purves, who each have over 30 years’ investment experience and have worked together for nearly 20 years across multiple market cycles. Alongside a team of global analysts, they are dedicated value investors seeking to identify undervalued, durable companies with strong cash flows and robust balance sheets.
Structural shifts driven by regulation, technological innovation, and the global energy transition are creating long-term growth opportunities across infrastructure sectors. Our team invests in publicly traded companies across developed and emerging markets that provide essential services and assets supporting economic activity and societal development.
Our Natural Capital strategy seeks to deliver long-term capital growth by investing in global companies that contribute to the preservation and restoration of the planet’s natural resources. As ecosystems come under increasing pressure from pollution and resource depletion, while remaining fundamental to economic and societal stability, we see a compelling opportunity in nature-positive solutions.
Our Active Ownership strategies are built on the belief that companies with active, engaged shareholders are more likely to generate superior long-term returns. The core focus of the strategies is to invest in concentrated portfolios of European and Japanese companies that are receptive to engagement, targeting fundamentally sound businesses with significant upside potential over a three- to five-year time horizon.

At Redwheel, Stewardship is our overarching approach to responsible investing, bringing together Sustainability, Active Ownership and Greenwheel Research & Insights into a single, disciplined framework. Through this framework we integrate material sustainability considerations into investment decisions, support investment teams with central expertise, and use focused engagement, proxy voting and thematic research to protect and enhance long-term client outcomes.

In November 2015, Ecofin launched the Global Renewables Infrastructure strategy (GRI) to capture the attractive investment returns arising from the structural changes underway in electricity and energy production. The strategy is designed to offer investors direct access to one of the fastest-growing segments of the energy complex as no/low carbon electricity takes share from other forms of electricity and electricity takes share from other forms of energy. By focusing on the infrastructure assets central to this technology shift, it provides exposure to the secular growth in electricity and cleaner power in particular, with less volatility and cyclicality inherent in the technology, equipment and industrial sectors involved in the space. The strategy therefore invests in companies that are likely to be the beneficiaries of innovation and declining cost curves with much lower levels of technology risk and economic cyclicality.
At the outset, we set the objective of delivering an annualised 8-12% absolute return while taking less risk than the market (lower beta). We believed that this target return was anchored in consistent rates of returns by developers and operators of newbuilt power assets (see the section on NextEra below). From an infrastructure perspective, we had the conviction that, based on our investment universe, we could create a portfolio that could deliver earnings growth of 6-8% and a dividend yield of 2-4%. Moreover, investing in real assets that are mainly regulated and/or contracted creates a low beta portfolio with high earnings visibility. Finally, given its preference for faster-growing cleaner power generation, we expect the strategy to deliver a very low carbon intensity profile without compromising on returns, a tangible benefit for sustainability-conscious investors.
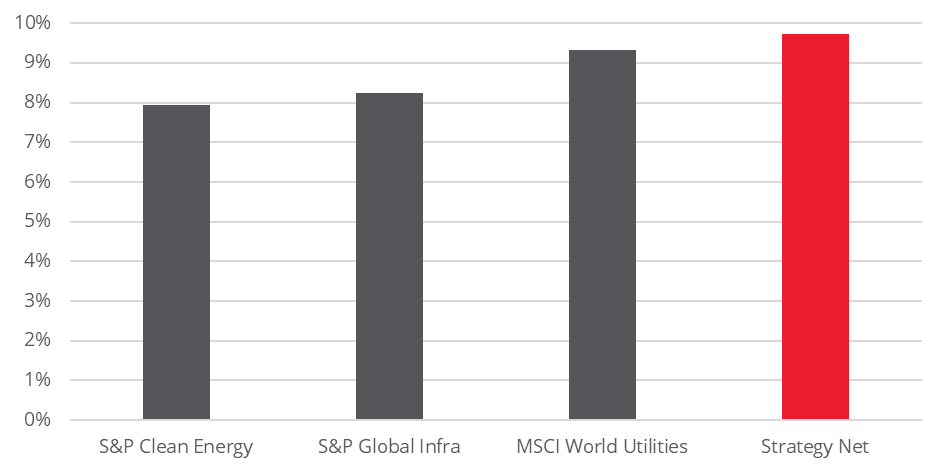
We are pleased to report that the strategy has delivered on expectations in the 10 years since inception – see Chart 1. It returned 10.69% gross and 9.74% net on an annualised basis with a beta of 0.74 to the MSCI AC World Index in an eventful decade, as we discuss later in the piece.
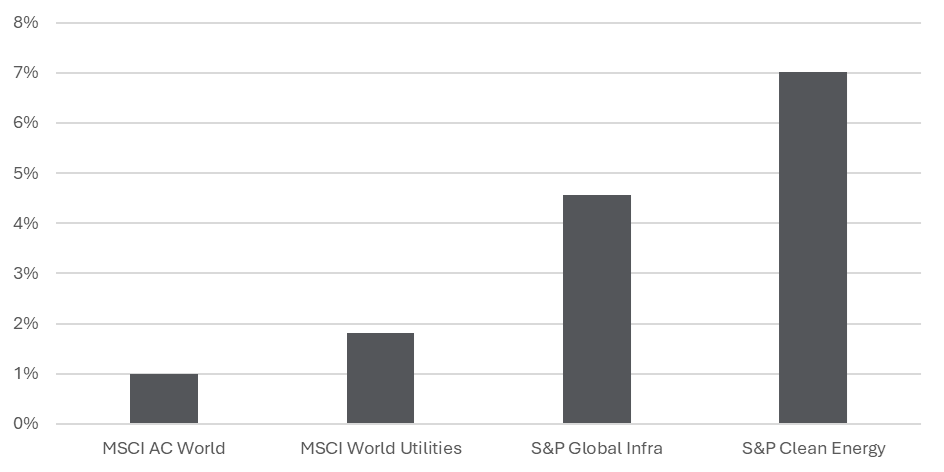
Moreover, investors will be happy to see in Charts 1 and 2 that the strategy has:
– Outperformed its official benchmark, the S&P Global Infrastructure Index, on a reported basis and even more on a beta-adjusted basis (Jensen’s Alpha);
– Outperformed the MSCI World Utilities Index and S&P Global Clean Energy Transition Index that are considered as relevant benchmarks by some of our investors, here also on a reported basis and even more on a beta-adjusted basis;
– Outperformed the MSCI AC World Index on a beta-adjusted basis despite having no exposure to the Tech sector, neither the FAANGS nor the Magnificent 7, that have carried markets higher.
Chart 1: The strategy (GRI) – Annualised performance since inception
Chart 2: The strategy (GRI) – Annualised Jensen’s alpha over each index since inception
Note: Chart 2 shows risk-adjusted performance of the strategy expressed as Jensen’s alpha. For each benchmark, we estimate the strategy’s return in excess of what would be expected given its market sensitivity (beta) and the benchmark’s return over the same period: i.e., the portion of performance not explained by systematic exposure. This differs from simple excess return (strategy return minus benchmark return) because excess return does not adjust for differences in beta; Jensen’s alpha explicitly accounts for beta and the benchmark’s realised return. The figures above have been calculated using 12-month returns over a 10-year period to the end of November 2025. Alpha figures have not been adjusted for the risk-free rate and are presented on an annualised basis. Alpha does not equal simple excess return but rather risk-adjusted excess return.
This outperformance has of course not been achieved every year given the sometimes-divergent headwinds faced by the sector and the market, but infrastructure investors who are and must be intrinsically long-term investors should find solace in looking at the past decade and its complexity when thinking about the coming decade.
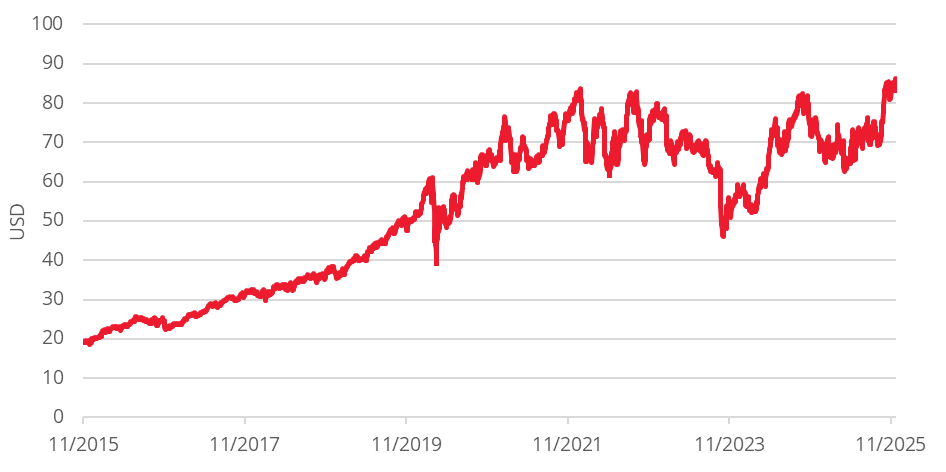
To illustrate how the strong internal rates of return we target in the portfolio flow through to equity performance over time, we look at NextEra Energy, the largest company in our investment universe and one of the true champions of innovation within the space.
For many types of public equities, small changes in growth or other fundamentals can trigger disproportionate moves in share prices, as investors periodically overreact to perceived risks or extrapolate good news too far. By contrast, in infrastructure we typically see a tighter, more mean‑reverting relationship between fundamentals and equity performance over time.
Over the period, the book value has compounded at an annualised 8.8% and earnings per share at an annualised 9.9%, while the average dividend yield has been 2.9%. This solid fundamental underpin supported a total annualised return of +16.1% – exactly the kind of compounding of growth and yield we aim to capture at portfolio level.
The share price can be volatile at times, like in 2023 when there were substantive reasons for concern on project funding costs amidst rapid interest rate changes, and material and labour cost escalations. This happened despite the absence of cuts to forward or realised earnings, creating an opportunity as the share price reverted to fundamentals.
Chart 3: NextEra – 10-year share price performance
We review below the operating environment and challenges faced in the past 10 years before moving to the outlook for the next 10 years when we see a once-in-a-lifetime super-cycle for power.
The past 10 years have been eventful at the geopolitical and policy levels. Below, we list the saliant developments that, in our view, had a direct or indirect impact on our strategy. These events were sometimes powerful positive catalysts while others proved to be extremely disruptive to the fundamentals of the sector.
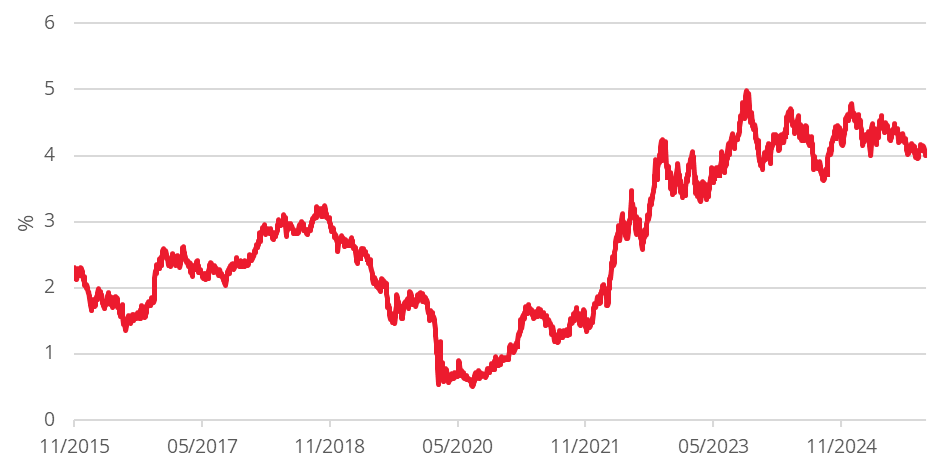
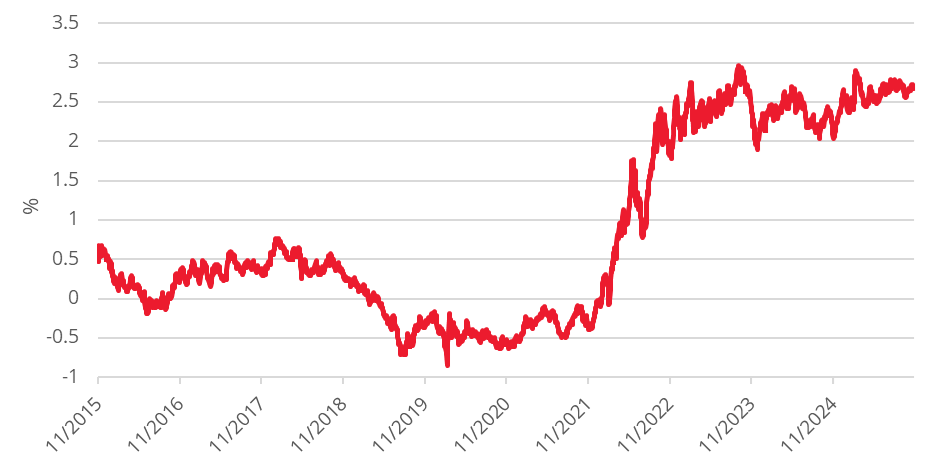
Against that backdrop, interest rate moves were violent and, as we explored in a recent paper [1], interest rates are an important factor affecting infrastructure returns. When these moved sharply from low levels to higher levels as we experienced in the past decade, they proved to be a powerful headwind to the capital-intensive companies we invest in. The good news, as we look forward, is that we are in a much higher interest rate environment, which is a more favourable starting point for the next decade.
Chart 4: US government – 10Y Yield
Chart 5: Euro government bond – 10Y Yield
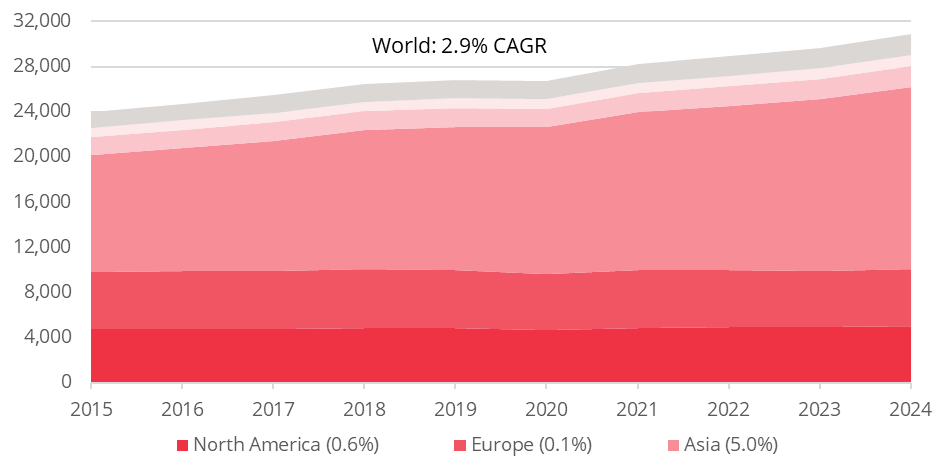
As far as the electricity market is concerned, in the past decade, developed economies recorded very modest growth in electricity consumption. The lack of substantial new sources of demand in developed markets and progress in energy efficiency (e.g. LEDs) can explain this subdued growth. Emerging markets during the same period experienced very substantial growth, particularly in those economies with a rising manufacturing and export-based economy or coming from very low bases of industrialisation [2].
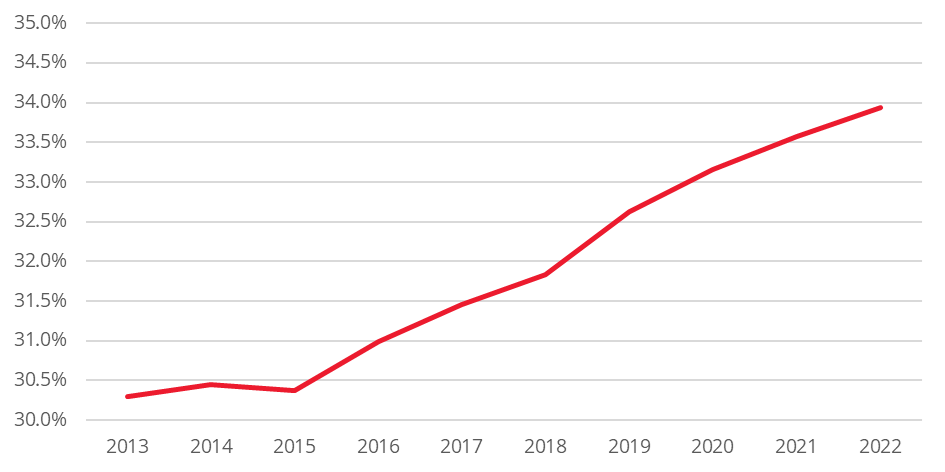
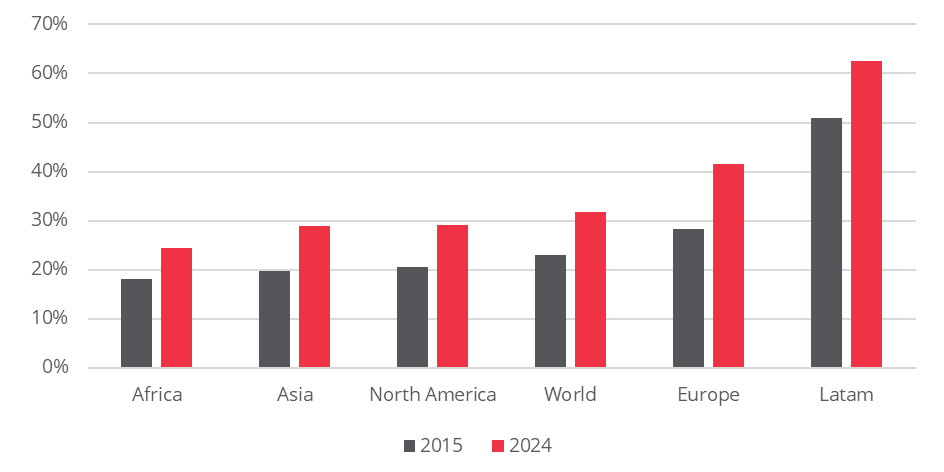
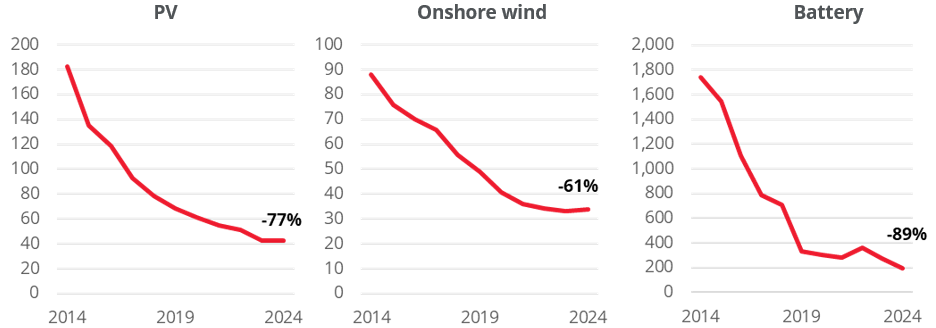
Looking under the surface, despite slow electricity growth (see Chart 6), electricity has taken share from other forms of energy (see Chart 7) and renewables have taken share from other forms of electricity (see Chart 8). Renewables were therefore one of the fastest areas of growth in energy. While a decade ago, the appeal of renewables was linked to climate change as equipment prices were elevated, the sharp decline in the cost of solar panels, wind turbines and batteries has allowed these technologies to compete on their merits, adding an economic argument to the climate change argument to support adoption. Moreover, since the start of the war in Ukraine, renewables have benefited from the realisation, especially in Europe, that energy security was a condition to ensure economic independence and sovereignty. This has reinforced the sentiment in Europe that substitution of fossil fuels by renewables was necessary sooner rather than later.
Chart 6: Global electricity generation – TWh
Chart 7: Electricity share of total energy demand
Chart 8: Electricity generation – Share of renewables
Chart 9: Costs of renewables (USD/MWh)
Our key message for the next 10 years is that when investors think about energy, they need to allocate or increase their allocation to electricity in their portfolio. Our conviction is that electricity is bound to gain market share and several electricity companies will become the majors that will eventually populate every global portfolio.
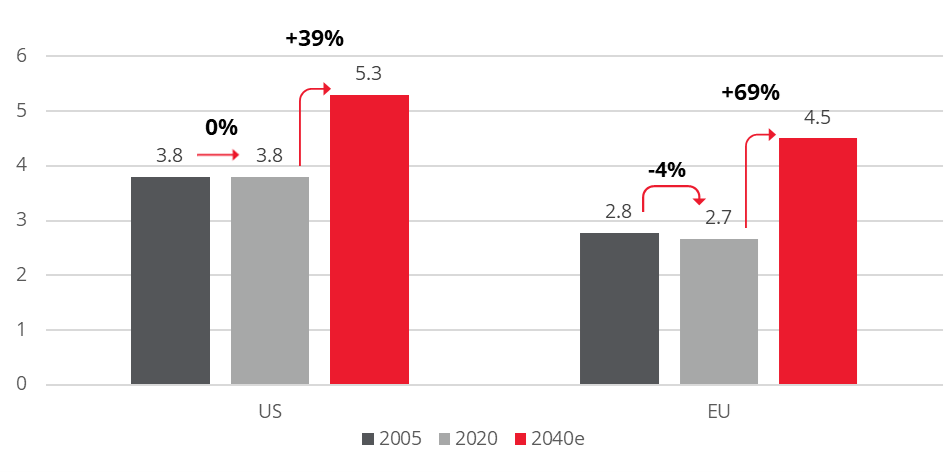
We believe that the super-cycle of electricity demand is real and will become more visible over time. Datacentre and AI growth has only just started in the US and China and they will scale up, while Europe and Latin America are a few years behind. Electric cars have become competitive alternatives to combustion engine vehicles in terms of price, range, features and appeal. A simple rule of thumb is that the electricity demand of an AI chip is equivalent to the consumption of an EV or a home. Of course, it varies by country as domestic electricity consumption varies widely, depending on whether there is air-conditioning and a heat pump, and whether the average car owner drives shorter or longer distances. But it is a fair assumption and we can therefore estimate that datacentres will create incremental demand for electricity equivalent to the electricity consumption of some of the largest cities in each country multiplied several times over during the next decade [3]. Moreover, replacing the entire automobile park by electric vehicles (China is already selling more electric cars than petrol cars) will be equivalent to doubling the population in Europe, for instance, and most other countries in terms of domestic electricity consumption[4].
Chart 10: Electricity consumption (‘000 TWh)
We believe that all this will solidly maintain electricity demand on a growth trajectory for the decade to come and require substantial investments in electricity generation, transmission and distribution.
As the contribution of intermittent renewables to total electricity generation (wind and solar) increases, we would expect price volatility to continue or rise, with 24/7 power attracting premium prices compared to intermittent power. However, once batteries and baseload power generation such as nuclear and geothermal are deployed at scale, we would expect price stabilisation.
Over the next 10 years, new technologies such as SMRs (Small Modular Reactors) and EGS (Enhanced Geothermal Systems) are likely to move from concepts to reality. Both share the benefits of being baseload and carbon-free and they will make generation more predictable, but they are not expected be a driver of deflation in the cost of generating electricity.
In a world that is becoming less predictable due to geopolitics and innovation, many industries are being disrupted at an unprecedented pace. Globalisation is in retreat and supply chains are being redesigned. Consider how AI is affecting the software or healthcare industry and its potential impact on numerous other industries. Or how electric vehicles are impacting the auto industry and Western OEMs in particular. GLP-1 agonists and their impacts on food, alcohol, fashion and transportation are yet another example.
In that context, we feel that the predictability of the companies that the strategy invests in – featuring business models that are regulated or contracted over long periods of time, that have a low exposure to volatile commodity prices, and that are beneficiaries and not victims of innovation and declining cost curves – should be a welcome feature in investors’ portfolios.
We believe that the attributes of the strategy that have been appealing in the past 10 years will continue in the coming 10 years, with a probability of a slight tilt to more positive outcomes given where we are today.
– Attractive returns and risk-adjusted returns: We aim to deliver returns in the range of 8-12% p.a. with a lower beta than the market.
– Moderate correlation with the market: The strategy profile provides diversification from an asset allocation perspective with an unusual mix of growth, yield and low beta.
Table 1: The strategy (GRI) – Correlation to key indices since inception
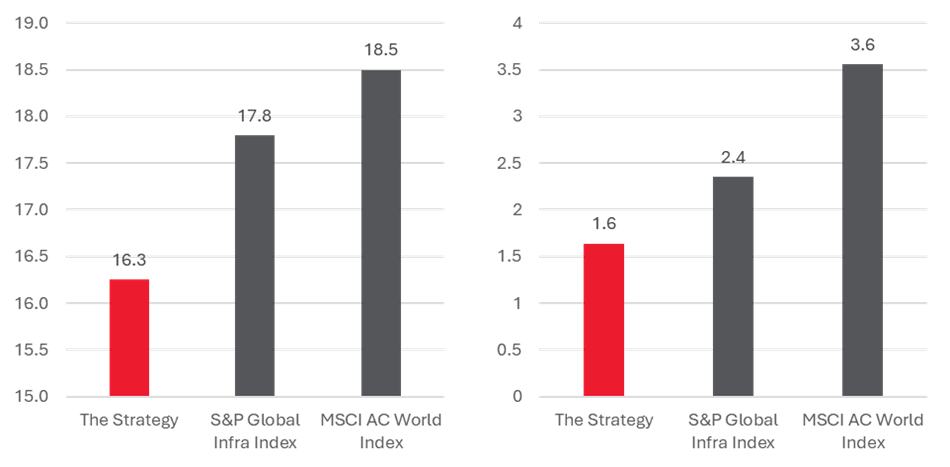
• Cheaper than the market: The strategy trades at lower multiples than the benchmark and the broader market.
Charts 11 and 12: The strategy (GRI) – Forward P/E (x) and Price to Book (x)
– Combination of yield and growth: The strategy combines a 3.6% dividend yield with around 8% expected EPS growth p.a. over the next few years. [5]
– Exposure to the mega-theme of electrification: This theme is not going away any time soon as rising demand for electricity stems from emerging datacentre/AI demand, still relatively low levels of penetration of electric vehicles globally, and the benefits of electricity over fossil fuels across many other applications.
– Low carbon intensity: In terms of decarbonisation impact, Scope 1 CO2 emissions from power generation are 63% lower per USD 1m invested in the fund compared to USD 1m invested in the MSCI World Utilities Index.[6]
In its first 10 years, the strategy has delivered attractive returns and even stronger beta-adjusted returns against sector and broader indices. It offers a yield to satisfy income-oriented investors and a low carbon intensity to satisfy sustainability-oriented investors. Taken together with the secular demand growth in electricity that is inflecting upward, low correlation and undemanding valuations, we believe that the strategy has the ingredients to appeal and succeed in the coming decade as well.
Key Information
No investment strategy or risk management technique can guarantee returns or eliminate risks in any market environment. Past performance is not a guide to the future. The prices of investments and income from them may fall as well as rise and investors may not get back the full amount invested. Forecasts and estimates are based upon subjective assumptions about circumstances and events that may not yet have taken place and may never do so. The statements and opinions expressed in this article are those of the author as of the date of publication, and do not necessarily represent the view of Redwheel. This article does not constitute investment advice and the information shown is for illustrative purposes only.
References
[1] See ‘Navigating market currents: Utilities are more than an interest rate play’, Redwheel, November 2025
[2] Bloomberg
[3] Source: US DOE Lawrence Berkeley National Laboratory & Barclays Research, January 2025; IEA, November 2024.
[4] Source: The global ‘trade war’ over China’s booming EV industry, China Passenger Car Association (CPCA), Carbon Brief, 2025.
[5] Source: Bloomberg, Redwheel estimates, January 2025
[6] Source: Carbon Analytics, Redwheel, December 2025

Ecofin Portfolio Manager Michel Sznajer examines his strategy’s performance after previous peaks in bond yields and identifies potential takeover targets amid falling valuations and improving earnings prospects. Read his latest insight on the investment case for the sector—and the risks that could keep it under pressure.
Balanced convertibles are once again delivering meaningful equity participation while outpacing investment grade credit. Davide Basile, Portfolio Manager, Redwheel Convertible Bonds, argues that convertibles have reached a turning point, read more in his latest insight.

Two holdings in the Redwheel Global Equity Income strategy have agreed to be acquired this year, while a third has attracted takeover speculation – rare for a strategy invested in large, liquid companies. Nick Clay, Portfolio Manager, considers what this may reveal about the opportunity in durable businesses overlooked by a market fixated on a single theme.
Redwheel ® and Ecofin ® are registered trademarks of RWC Partners Limited (“RWC”). The term “Redwheel” may include any one or more Redwheel branded regulated entities including RWC Asset Management LLP, which is authorised and regulated by the UK Financial Conduct Authority and the US Securities and Exchange Commission (“SEC”); RWC Asset Advisors (US) LLC, which is registered with the SEC; RWC Singapore (Pte) Limited, which is licensed as a Licensed Fund Management Company by the Monetary Authority of Singapore; Redwheel Australia Pty Ltd is an Australian Financial Services Licensee with the Australian Securities and Investment Commission; and Redwheel Europe Fondsmæglerselskab A/S which is regulated by the Danish Financial Supervisory Authority.
Redwheel may act as investment manager or adviser, or otherwise provide services, to more than one product pursuing a similar investment strategy or focus to the product detailed in this document. Redwheel and RWC (together “Redwheel Group”) seeks to minimise any conflicts of interest, and endeavours to act at all times in accordance with its legal and regulatory obligations as well as its own policies and codes of conduct.
This document is directed only at professional, institutional, wholesale or qualified investors. The services provided by Redwheel are available only to such persons. It is not intended for distribution to and should not be relied on by any person who would qualify as a retail or individual investor in any jurisdiction or for distribution to, or use by, any person or entity in any jurisdiction where such distribution or use would be contrary to local law or regulation.
This document has been prepared for general information purposes only and has not been delivered for registration in any jurisdiction nor has its content been reviewed or approved by any regulatory authority in any jurisdiction.
The information contained herein does not constitute: (i) a binding legal agreement; (ii) legal, regulatory, tax, accounting or other advice; (iii) an offer, recommendation or solicitation to buy or sell shares in any fund, security, commodity, financial instrument or derivative linked to, or otherwise included in a portfolio managed or advised by Redwheel; or (iv) an offer to enter into any other transaction whatsoever (each a “Transaction”). Redwheel Group bears no responsibility for your investment research and/or investment decisions and you should consult your own lawyer, accountant, tax adviser or other professional adviser before entering into any Transaction. No representations and/or warranties are made that the information contained herein is either up to date and/or accurate and is not intended to be used or relied upon by any counterparty, investor or any other third party.
Redwheel Group uses information from third party vendors, such as statistical and other data, that it believes to be reliable. However, the accuracy of this data, which may be used to calculate results or otherwise compile data that finds its way over time into Redwheel Group research data stored on its systems, is not guaranteed. If such information is not accurate, some of the conclusions reached or statements made may be adversely affected. Any opinion expressed herein, which may be subjective in nature, may not be shared by all directors, officers, employees, or representatives of Group and may be subject to change without notice. Redwheel Group is not liable for any decisions made or actions or inactions taken by you or others based on the contents of this document and neither Redwheel Group nor any of its directors, officers, employees, or representatives (including affiliates) accepts any liability whatsoever for any errors and/or omissions or for any direct, indirect, special, incidental, or consequential loss, damages, or expenses of any kind howsoever arising from the use of, or reliance on, any information contained herein.
Information contained in this document should not be viewed as indicative of future results. Past performance of any Transaction is not indicative of future results. The value of investments can go down as well as up. Certain assumptions and forward looking statements may have been made either for modelling purposes, to simplify the presentation and/or calculation of any projections or estimates contained herein and Redwheel Group does not represent that that any such assumptions or statements will reflect actual future events or that all assumptions have been considered or stated. There can be no assurance that estimated returns or projections will be realised or that actual returns or performance results will not materially differ from those estimated herein. Some of the information contained in this document may be aggregated data of Transactions executed by Redwheel that has been compiled so as not to identify the underlying Transactions of any particular customer.
No representations or warranties of any kind are intended or should be inferred with respect to the economic return from, or the tax consequences of, an investment in a Redwheel-managed fund.
This document expresses no views as to the suitability or appropriateness of the fund or any other investments described herein to the individual circumstances of any recipient.
The information transmitted is intended only for the person or entity to which it has been given and may contain confidential and/or privileged material. In accepting receipt of the information transmitted you agree that you and/or your affiliates, partners, directors, officers and employees, as applicable, will keep all information strictly confidential. Any review, retransmission, dissemination or other use of, or taking of any action in reliance upon, this information is prohibited. Any distribution or reproduction of this document is not authorised and is prohibited without the express written consent of Redwheel Group.
Funds managed by Redwheel are not, and will not be, registered under the Securities Act of 1933 (the “Securities Act”) and are not available for purchase by US persons (as defined in Regulation S under the Securities Act) except to persons who are “qualified purchasers” (as defined in the Investment Company Act of 1940) and “accredited investors” (as defined in Rule 501(a) under the Securities Act).
This document does not constitute an offer to sell, purchase, subscribe for or otherwise invest in units or shares of any fund managed by Redwheel. Any offering is made only pursuant to the relevant offering document and the relevant subscription application. Prospective investors should review the offering memorandum in its entirety, including the risk factors in the offering memorandum, before making a decision to invest.
AIFMD and Distribution in the European Economic Area (“EEA”)
The Alternative Fund Managers Directive (Directive 2011/61/EU) (“AIFMD”) is a regulatory regime which came into full effect in the EEA on 22 July 2014. RWC Asset Management LLP is an Alternative Investment Fund Manager (an “AIFM”) to certain funds managed by it (each an “AIF”). The AIFM is required to make available to investors certain prescribed information prior to their investment in an AIF. The majority of the prescribed information is contained in the latest Offering Document of the AIF. The remainder of the prescribed information is contained in the relevant AIF’s annual report and accounts. All of the information is provided in accordance with the AIFMD.
In relation to each member state of the EEA (each a “Member State”), this document may only be distributed and shares in a Redwheel fund (“Shares”) may only be offered and placed to the extent that (a) the relevant Redwheel fund is permitted to be marketed to professional investors in accordance with the AIFMD (as implemented into the local law/regulation of the relevant Member State); or (b) this document may otherwise be lawfully distributed and the Shares may lawfully be offered or placed in that Member State (including at the initiative of the investor).
Information Required for Offering in Switzerland of Foreign Collective Investment Schemes to Qualified Investors within the meaning of Article 10 CISA.
This is an advertising document.
The representative and paying agent of the Redwheel-managed funds in Switzerland (the “Representative in Switzerland”) FIRST INDEPENDENT FUND SERVICES LTD, Feldeggstrasse 12, CH-8008 Zurich. Swiss Paying Agent: Helvetische Bank AG, Seefeldstrasse 215, CH-8008 Zurich. In respect of the units of the Redwheel-managed funds offered in Switzerland, the place of performance is at the registered office of the Swiss Representative. The place of jurisdiction is at the registered office of the Swiss Representative or at the registered office or place of residence of the investor.
No investment strategy or risk management technique can guarantee returns or eliminate risks in any market environment.The term “RWC” may include any one or more RWC branded entities including RWC Partners Limited and RWC Asset Management LLP, each of which is authorised and regulated by the UK Financial Conduct Authority and, in the case of RWC Asset Management LLP, the US Securities and Exchange Commission; RWC Asset Advisors (US) LLC, which is registered with the US Securities and Exchange Commission; and RWC Singapore (Pte) Limited, which is licensed as a Licensed Fund Management Company by the Monetary Authority of Singapore.RWC may act as investment manager or adviser, or otherwise provide services, to more than one product pursuing a similar investment strategy or focus to the product detailed in this audio. RWC seeks to minimise any conflicts of interest, and endeavours to act at all times in accordance with its legal and regulatory obligations as well as its own policies and codes of conduct.This audio is directed only at professional, institutional, wholesale or qualified investors. The services provided by RWC are available only to such persons. It is not intended for distribution to and should not be relied on by any person who would qualify as a retail or individual investor in any jurisdiction or for distribution to, or use by, any person or entity in any jurisdiction where such distribution or use would be contrary to local law or regulation.This audio has been prepared for general information purposes only and has not been delivered for registration in any jurisdiction nor has its content been reviewed or approved by any regulatory authority in any jurisdiction. The information contained herein does not constitute: (i) a binding legal agreement; (ii) legal, regulatory, tax, accounting or other advice; (iii) an offer, recommendation or solicitation to buy or sell shares in any fund, security, commodity, financial instrument or derivative linked to, or otherwise included in a portfolio managed or advised by RWC; or(iv) an offer to enter into any other transaction whatsoever (each a “Transaction”). No representations and/or warranties are made that the information contained herein is either up to date and/or accurate and is not intended to be used or relied upon by any counterparty, investor or any other third party.RWC uses information from third party vendors, such as statistical and other data, that it believes to be reliable. However, the accuracy of this data, which may be used to calculate results or otherwise compile data that finds its way over time into RWC research data stored on its systems, is not guaranteed. If such information is not accurate, some of the conclusions reached or statements made may be adversely affected. RWC bears no responsibility for your investment research and/or investment decisions and you should consult your own lawyer, accountant, tax adviser or other professional adviser before entering into any Transaction. Any opinion expressed herein, which may be subjective in nature, may not be shared by all directors, officers, employees, or representatives of RWC and may be subject to change without notice. RWC is not liable for any decisions made or actions or in actions taken by you or others based on the contents of this audio and neither RWC nor any of its directors, officers, employees, or representatives (including affiliates) accepts any liability whatsoever for any errors and/or omissions or for any direct, indirect, special, incidental, or consequential loss, damages, or expenses of any kind howsoever arising from the use of, or reliance on, any information contained herein.Information contained in this audio should not be viewed as indicative of future results. Past performance of any Transaction is not indicative of future results. The value of investments can go down as well as up. Certain assumptions and forward looking statements may have been made either for modelling purposes, to simplify the audio and/or calculation of any projections or estimates contained herein and RWC does not represent that that any such assumptions or statements will reflect actual future events or that all assumptions have been considered or stated. Forward-looking statements are inherently uncertain, and changing factors such as those affecting the markets generally, or those affecting particular industries or issuers, may cause results to differ from those discussed. Accordingly, there can be no assurance that estimated returns or projections will be realised or that actual returns or performance results will not materially differ from those estimated herein. Some of the information contained in this audio may be aggregated data of Transactions executed by RWC that has been compiled so as not to identify the underlying Transactions of any particular customer.The information transmitted is intended only for the person or entity to which it has been given and may contain confidential and/or privileged material. In accepting receipt of the information transmitted you agree that you and/or your affiliates, partners, directors, officers and employees, as applicable, will keep all information strictly confidential. Any review, retransmission, dissemination or other use of, or taking of any action in reliance upon, this information is prohibited. The information contained herein is confidential and is intended for the exclusive use of the intended recipient(s) to which this audio has been provided. Any distribution or reproduction of this audio is not authorised and is prohibited without the express written consent of RWC or any of its affiliates.Changes in rates of exchange may cause the value of such investments to fluctuate. An investor may not be able to get back the amount invested and the loss on realisation may be very high and could result in a substantial or complete loss of the investment. In addition, an investor who realises their investment in a RWC-managed fund after a short period may not realise the amount originally invested as a result of charges made on the issue and/or redemption of such investment. The value of such interests for the purposes of purchases may differ from their value for the purpose of redemptions. No representations or warranties of any kind are intended or should be inferred with respect to the economic return from, or the tax consequences of, an investment in a RWC-managed fund. Current tax levels and reliefs may change. Depending on individual circumstances, this may affect investment returns. Nothing in this document constitutes advice on the merits of buying or selling a particular investment. This audio expresses no views as to the suitability or appropriateness of the fund or any other investments described herein to the individual circumstances of any recipient.AIFMD and Distribution in the European Economic Area (“EEA”)The Alternative Fund Managers Directive (Directive 2011/61/EU)(“AIFMD”) is a regulatory regime which came into full effect in the EEA on 22 July 2014. RWC Asset Management LLP is an Alternative Investment Fund Manager (an “AIFM”) to certain funds managed by it (each an “AIF”). The AIFM is required to make available to investors certain prescribed information prior to their investment in an AIF. The majority of the prescribed information is contained in the latest Offering Document of the AIF. The remainder of the prescribed information is contained in the relevant AIF’s annual report and accounts. All of the information is provided in accordance with the AIFMD.In relation to each member state of the EEA (each a “Member State”),this document may only be distributed and shares in a RWC fund(“Shares”) may only be offered and placed to the extent that (a) the relevant RWC fund is permitted to be marketed to professional investors in accordance with the AIFMD (as implemented into the local law/regulation of the relevant Member State); or (b) this audio may otherwise be lawfully distributed and the Shares may lawfully offered or placed in that Member State (including at the initiative of the investor).Information Required for Distribution of Foreign Collective Investment Schemes to Qualified Investors in SwitzerlandThe representative and paying agent of the RWC-managed funds in Switzerland (the “Representative in Switzerland”) FIRST INDEPENDENT FUND SERVICES LTD, Klausstrasse 33, CH-8008 Zurich. Swiss Paying Agent: Helvetische Bank AG, Seefeldstrasse 215, CH-8008 Zurich. In respect of the units of the RWC-managed funds distributed in Switzerland, the place of performance and jurisdiction is at the registered office of the Representative in Switzerland.