










Navigating market currents: Utilities are more than an interest rate play

As interest rates in the US, Europe, the UK and Brazil appear to have peaked, we examine how the global listed utilities sector could behave if these interest rates were to come down.

It has long been considered that the dynamics of interest rates and yield curves were the primary drivers of sector performance. Investors keenly watched these indicators as signals about the economic cycle and appropriate portfolio positioning: risk-on vs. risk-off. However, times have changed as utilities have more growth than before, notably through the development of non-regulated activities, and considering them only as bond proxies is less appropriate as the sector evolves. In addition, many utilities now include inflation pass-through mechanisms in their regulated frameworks or deregulated contracts (eg. in wind and solar power purchase agreements (PPAs).

Although interest rates remain important for capital-intensive companies and lower interest rates would be an undeniable tailwind for the sector, notably due to asset allocation flows, we believe there are now other factors/drivers of performance – and relative performance in particular.

Key takeaways

  • Plateauing or declining interest rates typically create a more favourable environment for utility companies, influencing cash flow discounting and financing costs, dividend appeal, and investor sentiment 
  • Active management can leverage rate-driven dislocations within utilities (both across and within sub-sectors) to enhance returns and reduce risk through active positioning 
  • Once seen as mere defensive bond proxies, utilities are now exposed to structural growth trends underpinned by electrification, surging power demand and the explosive growth of data centres

Why do utilities benefit from lower rates?

Lower interest rates can create a more favourable environment for utility companies, influencing everything from financing costs to investor appeal. As borrowing becomes cheaper, utilities often find new opportunities to refinance debt on favourable terms, strengthen balance sheets, and invest in new infrastructure at a lower cost – topics explored in greater depth below.

Cash flow discounting: regulated utility companies are rate-sensitive because declining interest rates decrease their cost of capital and increase the present value of long-term cash flows.

Lower borrowing costs: utilities are typically highly capital-intensive, meaning they borrow significant amounts of debt to fund long-duration infrastructure investments such as power lines or water networks. Lower interest rates reduce their borrowing costs, which in turn leads to improved earnings and returns.

Increased dividend appeal: utilities tend to be seen as bond proxies due to their relatively stable and visible contracted and regulated revenue streams, often translating into dividend payments. When interest rates fall, bonds become less attractive, causing investors to shift into higher-yielding utilities, which drives stock prices higher.

Improved risk-reward profile: lower rates combined with the structural trends such as the electrification of the economy, grid modernisation and renewable energy investments make utility stocks compelling alternatives to fixed income products.

Chart 1 illustrates the inverse relationship between utilities and rates. Based on 5-year correlations, the European utilities sector (SX6P index) has the second-highest negative relationship to German 10-year bond yields, following real estate which is often viewed as another defensive bond-like investment. 

Chart 1: Utility stocks show the second-highest negative correlation to bond yields
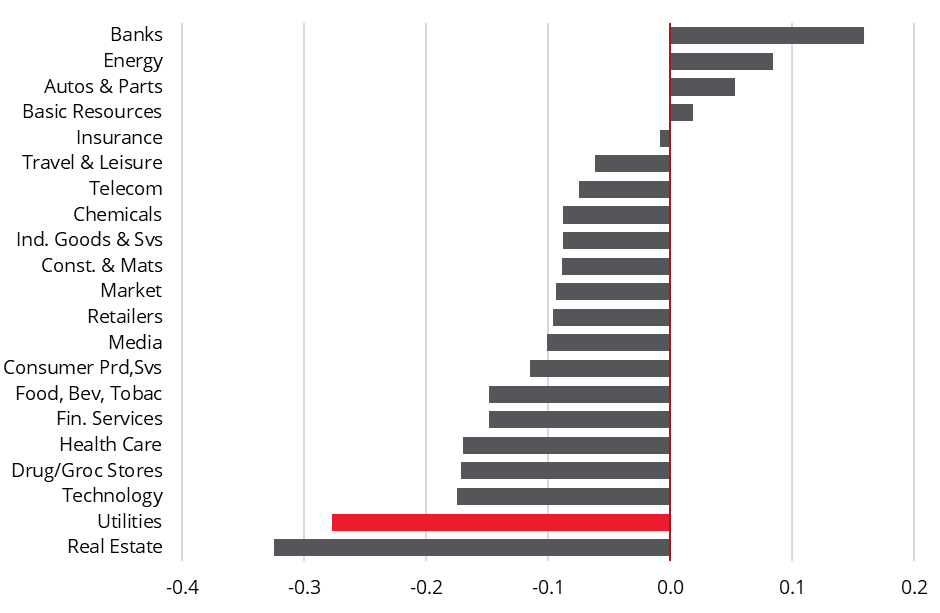
Source: Bloomberg, Ecofin, 20 October 2025. 5-year correlation between weekly moves in German 10-year bond yields and price performance. A correlation of 1 signifies a perfect correlation; -1, a perfectly inverse correlation. The information shown above is for illustrative purposes.

European utility stocks are most sensitive to rates during regime changes

Utilities are particularly sensitive to large swings in interest rates as these regime changes abruptly shift their borrowing costs, disrupting their medium-term financial planning and expected return on capital.

While some utility companies are able to pass through the impact of higher interest rates – automatically in some regulatory jurisdictions or indirectly via higher PPA prices – there is nonetheless a potential negative timing impact on cash flows. In addition, some projects (especially in renewables) have lengthy durations and returns can become uneconomical when rates jump sharply in a relatively short period of time. Smaller and more progressive rate changes typically allow for gradual adjustment, but big hikes sharply elevate the weighted average cost of capital (WACC), compressing returns, and in some cases forcing delays or cancellations of capital-intensive investments.

To illustrate this point, we take a closer look at the two main rate regime changes which took place in Europe over the last 15 years below: the 2013-15 easing cycle and the 2021-22 tightening cycle.

2013-2015 easing cycle: Eurozone interest rates plunged to historic lows as the ECB fought to revive a fragile post-crisis economy. The region was still reeling from the sovereign debt turmoil with weak growth, record unemployment and dangerously low inflation. To counter this stagnation, the ECB embarked on an unprecedented wave of monetary easing measures which resulted in a >250bps decrease in bond yields. Utilities performed well during this period, with the European utilities benchmark up >35% [1].

2021-2022 tightening cycle: interest rates across the European Union surged at an unprecedented pace between 2021-23, as policymakers scrambled to contain runaway inflation. After years of ultra-loose monetary policy, the post-pandemic rebound collided with supply chain disruptions, soaring energy costs and the economic fallout from the invasion of Ukraine – all of which sent prices surging. Soaring inflation forced the ECB to pivot sharply from stimulus to restraint and deliver a series of aggressive rate hikes. Higher rates combined with spiralling inflation put growth prospects of many companies into question. This also put project-level returns under pressure and resulted in material valuation multiple compression. Utilities clearly struggled (-21%) as rates increased by >300bps over the period [2]

These two examples clearly demonstrate that the inverse correlation between utilities’ performance and rates is much higher when we are witnessing a regime change rather than modest moves within a range.

Chart 2: European utilities are most sensitive to rates during regime changes
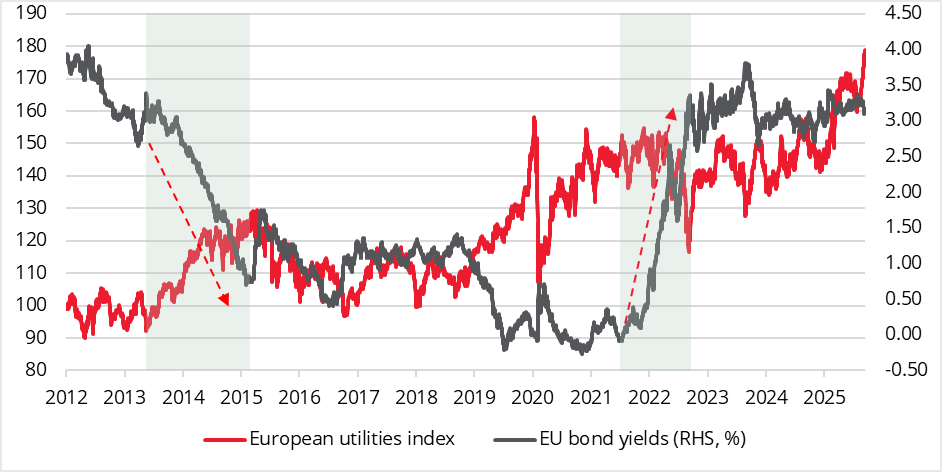
Source: Bloomberg, Ecofin, 20 October 2025. European utilities price performance (LHS, rebased to 100), EU 10-year bond yields (RHS, %). Past performance is not a guide to the future. The information shown above is for illustrative purposes.

Not all utilities are created equal: intra-sector disparities

Not all corners of the utilities sector move in lockstep when interest rates rise or fall. The correlation can vary sharply across (and to some extent within) sub-sectors because each has its own mix of regulatory environment, capital intensity and exposure to market forces.

  • Traditional regulated electric and gas utilities tend to have the highest negative correlation to rate moves as their high debt levels make financing more expensive, and their steady dividends look less attractive compared with higher bond yields.
  • Integrated utilities typically operate a combination of regulated transmission & distribution assets, generation and retail. As such, these companies also tend to have elevated gearing levels and are sensitive to rate moves.
  • Renewable energy companies mostly feel rate shifts through the project-financing channel as higher borrowing costs can delay new developments and compress valuations built on long-term discounted cash flows.
  • Generation companies are typically well-established, low growth businesses with strong balance sheets and are therefore much less correlated to rate moves. By contrast, these names tend to be much more sensitive to commodity prices (eg. gas, coal). 

1-year and 5-year correlations summarised in exhibit 3 below illustrate these intra-sector disparities.

Chart 3: European regulated and integrated utilities have the highest rates sensitivity
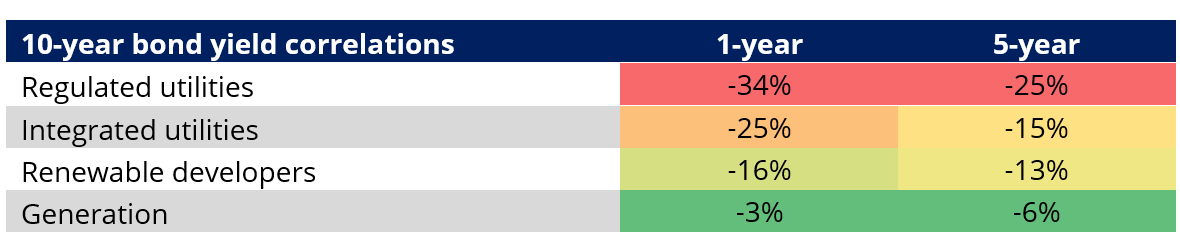
Source: Bloomberg, Ecofin, 31 October 2025. European utilities 1-year and 5-year daily returns correlation with 10-year bond yields to end October 2025. The information shown above is for illustrative purposes.

Even within a single sub-sector, individual stocks can display markedly different correlations to interest rates, reflecting the nuances of their business models, capital structures and market positioning. Two regulated electric utilities may both rely on steady cash flows, but one with heavier debt, more floating rate debt or short maturity, or aggressive dividend policies will be more sensitive to rising rates than a more conservatively financed peer. Similarly, renewable energy firms with long-term PPAs may react differently depending on the mix of government incentives, inflation-adjusting contracts, and geographic exposure. Factors such as contract length, regulatory environment, leverage and exposure to commodity prices shape how each company responds to interest rate moves.

Chart 4: Despite clear trends at sub-sector levels, intra-sector dispersion is high
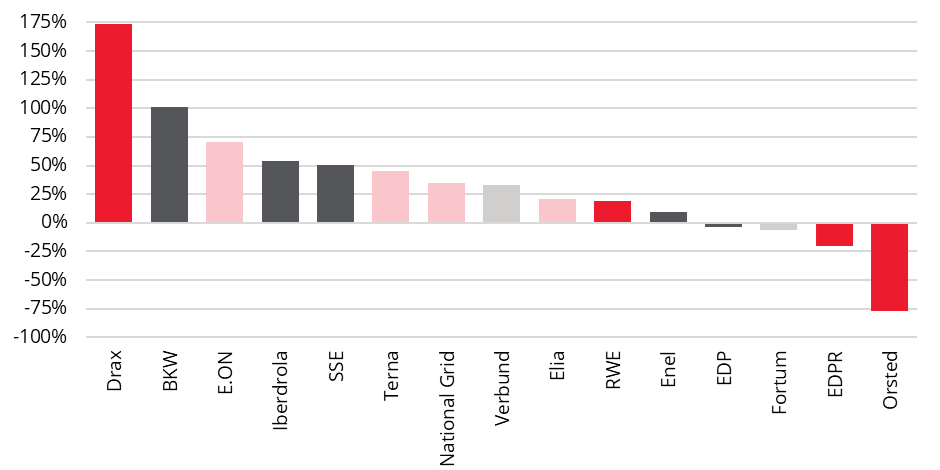
Note: Red: renewables, Black: integrated, Pink: regulated, Grey: generation Source: Bloomberg, Ecofin, 30 September 2025. 5-year price performance in USD. The information shown above is for illustrative purposes.

US vs. European utilities: (mostly) similar patterns across the pond

US utilities, much like their European counterparts, exhibit a pronounced sensitivity to interest rate movements. With their business models built on long-term, regulated cash flows and capital-intensive infrastructure, higher rates raise the cost of debt and reduce the present value of future earnings. In an environment of low interest rates, these companies typically become particularly attractive to income-seeking investors, offering steady dividends and defensive stability that mirror bond-like characteristics.

We repeat the exercise we have done for Europe and take a closer look at the two main regime changes which took place in the US over the last 15 years below: the 2018-20 easing cycle and the 2021-23 tightening cycle.

2018-2020 easing cycle: The 2018-20 US rate easing cycle marked a sharp Fed pivot from tightening to stimulus. After raising rates steadily through 2018, policymakers reversed course in 2019 with three precautionary cuts to buffer trade tensions and slowing global growth. The shift turned dramatic in early 2020 as the COVID-19 shock forced emergency action and rates were slashed to near zero. US utilities rallied 30% while rates decreased by >165bps over that period (excluding the impact of the COVID crisis) [3]

2021-2023 tightening cycle: This was one of the Fed’s most aggressive tightening cycles in decades, aimed at reigning on inflation that surged after the pandemic stimulus boom. The Fed pivoted in March 2022, delivering 11 hikes in just 17 months to lift its funds rate above 5%. In this challenging context, rates increased by >300bps and US utilities sold off by 20% over the period [4].

Chart 5: US utilities are also most sensitive to rates during regime changes
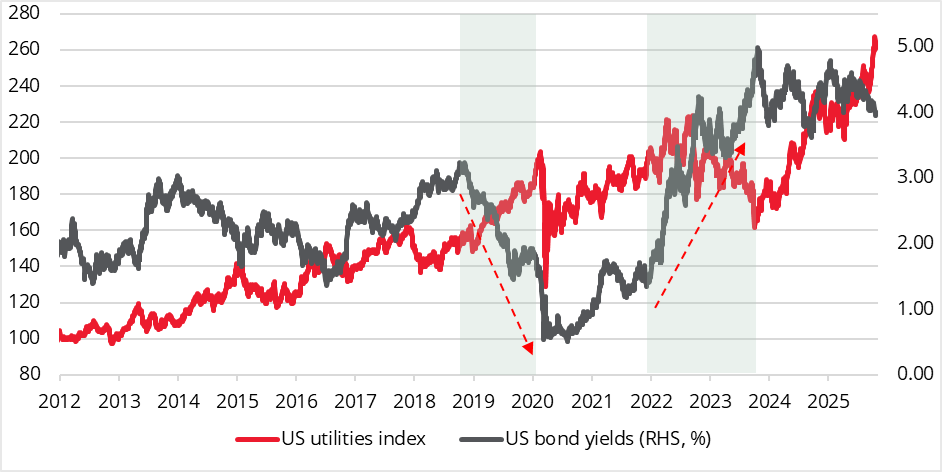
Source: Bloomberg, Ecofin, 21 October 2025. US utilities price performance (LHS, rebased to 100), US 10-year bond yields (RHS, %). Past performance is not a guide to the future.

However, not all US utilities fit the classic interest rate-sensitive profile. Independent power producers (IPPs) like Vistra, Constellation and Talen have largely bucked the trend, thanks to lower leverage and strong free cash flow generation. These companies have also been beneficiaries of the “nuclear renaissance” and the surging power demand from data centres and other digital infrastructure. With robust earnings growth and less reliance on debt financing, IPPs are likely to withstand monetary tightening more effectively, highlighting the nuanced diversity within the US utilities landscape – similar to Europe.

Chart 6: US IPPs have bucked the trend and outperformed strongly in recent years
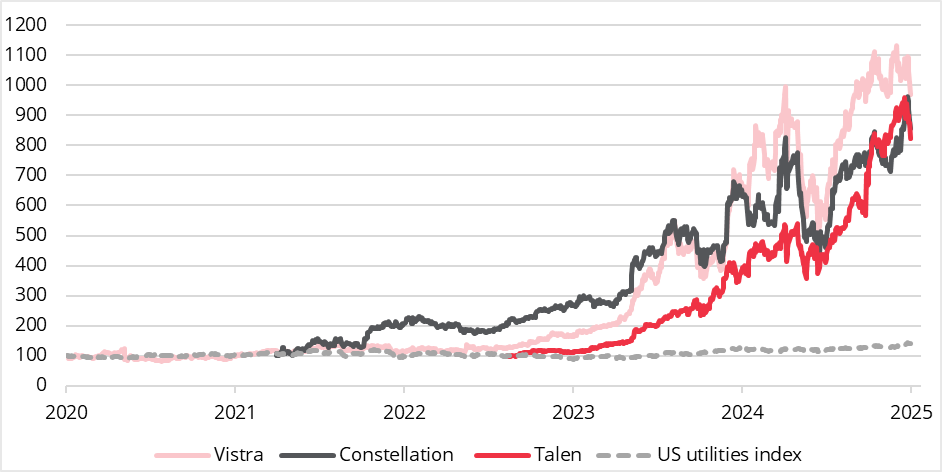
Source: Bloomberg, Ecofin, 21 October. 5-year price performance (indexed to 100). Past performance is not a guide to the future. The information shown above is for illustrative purposes.

Recent US policy clarity has enhanced the appeal of US utilities. After the turbulence of pandemic-related demand swings and energy market volatility, the combination of predictable earnings, infrastructure modernisation, and an ongoing push toward renewable integration positions the sector to benefit from a lower rate backdrop. In this way, US utilities share many of the same rate-driven dynamics as European peers, demonstrating that interest rates remain a key lever shaping valuations on both sides of the Atlantic.

What about yield curve moves?

The relationship between utilities and the yield curve has been a key area of focus for sector specialists and generalists alike. As described above, utilities are traditionally seen as bond-like investments. When the yield curve steepens and long-term rates rise, those bond-like attributes lose some of their shine, as investors can earn higher yields from safer fixed-income assets. Conversely, when the curve flattens or inverts, typically signalling economic slowdown, utilities tend to outperform – benefiting from their defensive reputation and steady cash flows.

However, the impact is not uniform. Regulated utilities with inflation-linked pricing mechanisms or predictable returns can withstand steeper yield curves much better than those with no inflation protection or unhedged debt.

Conclusion

The interplay between interest rates, yield curve movements, and equity markets is complex, especially for a sector as capital-intensive as utilities. While rising rates generally increase financing costs and pose challenges, some utilities benefit from regulatory and inflation protection mechanisms which allow them to partially offset the negative impact.

In a shifting rate environment, active management can add real value by actively rotating across utilities sub-sectors that respond differently to monetary trends. By understanding the nuances of capital structure, regulation, and demand dynamics, active management can position a portfolio to capture opportunities and cushion risk as rate regimes evolve – turning sector complexity into a competitive edge.

We believe the outlook for utilities has brightened markedly now that the shocks of the past few years – COVID disruptions, energy market turmoil from the Ukraine war, and US policy headwinds – have eased. Moreover, the rising prospects of declining interest rates should translate into a strong tailwind for the sector that remains attractively valued despite all the positive drivers.

Finally, it is worth highlighting that the utilities sector has outgrown its image as a mere bond proxy, emerging as a key driver of the global energy transition. Electrification, surging power demand and the explosive growth of data centres have transformed utilities into growth assets rather than just income plays. As electricity becomes the backbone of modern industry and digital infrastructure, utilities now offer a blend of stability and long-term expansion that sets them apart from their traditionally defensive past. 

Sources:

[1] Bloomberg, 26 June 2013 – 15 April 2015

[2] Bloomberg, 13 December 2021 – 12 October 2022

[3] Bloomberg, 6 November 2018 – 18 February 2020

[4] Bloomberg, 15 December 2021 – 2 October 2023

Key Information

No investment strategy or risk management technique can guarantee returns or eliminate risks in any market environment. Past performance is not a guide to the future. The prices of investments and income from them may fall as well as rise and investors may not get back the full amount invested. Forecasts and estimates are based upon subjective assumptions about circumstances and events that may not yet have taken place and may never do so. The statements and opinions expressed in this article are those of the author as of the date of publication, and do not necessarily represent the view of Redwheel. This article does not constitute investment advice and the information shown is for illustrative purposes only.

In case you missed it

Emerging and Frontier Markets
The ‘Fab 4’ become the ‘FOMO 3’

The Redwheel Emerging and Frontier Markets team explores the concentration challenge facing investors today and maps out under‑owned countries, sectors and themes that the team believes offer a richer blend of structural growth and genuine diversification.

27 July, 2026 | 01:48pm
UK Value & income
When it rhymes it pours

Shaul Rosten, Analyst with the Redwheel Value and Income team looks at the striking similarities between today’s market exuberance and the dotcom era, highlighting stretched valuations, record IPO activity and the dominance of the technology sector.

20 July, 2026 | 07:58pm
UK Value & income
Two beautiful games

As England’s World Cup campaign unfolds, the tournament provides a vivid reminder that sensible bets are grounded in probabilities. Supporters know that backing long-shot teams is unlikely to be rewarded, while favouring stronger sides with clear track records is more prudent. In his latest blog, Shaul Rosten of Redwheel's Value & Income team examines how value investing adopts a similar stance, focusing on quality businesses at attractive valuations, rather than richly priced growth narratives with low odds of delivery.

6 July, 2026 | 07:29pm

Disclaimer

Redwheel ® and Ecofin ® are registered trademarks of RWC Partners Limited (“RWC”). The term “Redwheel” may include any one or more Redwheel branded regulated entities including RWC Asset Management LLP, which is authorised and regulated by the UK Financial Conduct Authority and the US Securities and Exchange Commission (“SEC”); RWC Asset Advisors (US) LLC, which is registered with the SEC;  RWC Singapore (Pte) Limited, which is licensed as a Licensed Fund Management Company by the Monetary Authority of Singapore; Redwheel Australia Pty Ltd is an Australian Financial Services Licensee with the Australian Securities and Investment Commission; and Redwheel Europe Fondsmæglerselskab A/S which is regulated by the Danish Financial Supervisory Authority.

Redwheel may act as investment manager or adviser, or otherwise provide services, to more than one product pursuing a similar investment strategy or focus to the product detailed in this document. Redwheel and RWC (together “Redwheel Group”) seeks to minimise any conflicts of interest, and endeavours to act at all times in accordance with its legal and regulatory obligations as well as its own policies and codes of conduct.

This document is directed only at professional, institutional, wholesale or qualified investors. The services provided by Redwheel are available only to such persons. It is not intended for distribution to and should not be relied on by any person who would qualify as a retail or individual investor in any jurisdiction or for distribution to, or use by, any person or entity in any jurisdiction where such distribution or use would be contrary to local law or regulation.

This document has been prepared for general information purposes only and has not been delivered for registration in any jurisdiction nor has its content been reviewed or approved by any regulatory authority in any jurisdiction.

The information contained herein does not constitute: (i) a binding legal agreement; (ii) legal, regulatory, tax, accounting or other advice; (iii) an offer, recommendation or solicitation to buy or sell shares in any fund, security, commodity, financial instrument or derivative linked to, or otherwise included in a portfolio managed or advised by Redwheel; or (iv) an offer to enter into any other transaction whatsoever (each a “Transaction”). Redwheel Group bears no responsibility for your investment research and/or investment decisions and you should consult your own lawyer, accountant, tax adviser or other professional adviser before entering into any Transaction. No representations and/or warranties are made that the information contained herein is either up to date and/or accurate and is not intended to be used or relied upon by any counterparty, investor or any other third party.

Redwheel Group uses information from third party vendors, such as statistical and other data, that it believes to be reliable. However, the accuracy of this data, which may be used to calculate results or otherwise compile data that finds its way over time into Redwheel Group research data stored on its systems, is not guaranteed. If such information is not accurate, some of the conclusions reached or statements made may be adversely affected. Any opinion expressed herein, which may be subjective in nature, may not be shared by all directors, officers, employees, or representatives of Group and may be subject to change without notice. Redwheel Group is not liable for any decisions made or actions or inactions taken by you or others based on the contents of this document and neither Redwheel Group nor any of its directors, officers, employees, or representatives (including affiliates) accepts any liability whatsoever for any errors and/or omissions or for any direct, indirect, special, incidental, or consequential loss, damages, or expenses of any kind howsoever arising from the use of, or reliance on, any information contained herein.

Information contained in this document should not be viewed as indicative of future results. Past performance of any Transaction is not indicative of future results. The value of investments can go down as well as up. Certain assumptions and forward looking statements may have been made either for modelling purposes, to simplify the presentation and/or calculation of any projections or estimates contained herein and Redwheel Group does not represent that that any such assumptions or statements will reflect actual future events or that all assumptions have been considered or stated. There can be no assurance that estimated returns or projections will be realised or that actual returns or performance results will not materially differ from those estimated herein. Some of the information contained in this document may be aggregated data of Transactions executed by Redwheel that has been compiled so as not to identify the underlying Transactions of any particular customer.

No representations or warranties of any kind are intended or should be inferred with respect to the economic return from, or the tax consequences of, an investment in a Redwheel-managed fund.

This document expresses no views as to the suitability or appropriateness of the fund or any other investments described herein to the individual circumstances of any recipient.

The information transmitted is intended only for the person or entity to which it has been given and may contain confidential and/or privileged material. In accepting receipt of the information transmitted you agree that you and/or your affiliates, partners, directors, officers and employees, as applicable, will keep all information strictly confidential. Any review, retransmission, dissemination or other use of, or taking of any action in reliance upon, this information is prohibited. Any distribution or reproduction of this document is not authorised and is prohibited without the express written consent of Redwheel Group.

Funds managed by Redwheel are not, and will not be, registered under the Securities Act of 1933 (the “Securities Act”) and are not available for purchase by US persons (as defined in Regulation S under the Securities Act) except to persons who are “qualified purchasers” (as defined in the Investment Company Act of 1940) and “accredited investors” (as defined in Rule 501(a) under the Securities Act).

This document does not constitute an offer to sell, purchase, subscribe for or otherwise invest in units or shares of any fund managed by Redwheel. Any offering is made only pursuant to the relevant offering document and the relevant subscription application. Prospective investors should review the offering memorandum in its entirety, including the risk factors in the offering memorandum, before making a decision to invest.

AIFMD and Distribution in the European Economic Area (“EEA”)

The Alternative Fund Managers Directive (Directive 2011/61/EU) (“AIFMD”) is a regulatory regime which came into full effect in the EEA on 22 July 2014. RWC Asset Management LLP is an Alternative Investment Fund Manager (an “AIFM”) to certain funds managed by it (each an “AIF”). The AIFM is required to make available to investors certain prescribed information prior to their investment in an AIF. The majority of the prescribed information is contained in the latest Offering Document of the AIF. The remainder of the prescribed information is contained in the relevant AIF’s annual report and accounts. All of the information is provided in accordance with the AIFMD.

In relation to each member state of the EEA (each a “Member State”), this document may only be distributed and shares in a Redwheel fund (“Shares”) may only be offered and placed to the extent that (a) the relevant Redwheel fund is permitted to be marketed to professional investors in accordance with the AIFMD (as implemented into the local law/regulation of the relevant Member State); or (b) this document may otherwise be lawfully distributed and the Shares may lawfully be offered or placed in that Member State (including at the initiative of the investor).

Information Required for Offering in Switzerland of Foreign Collective Investment Schemes to Qualified Investors within the meaning of Article 10 CISA.

This is an advertising document.

The representative and paying agent of the Redwheel-managed funds in Switzerland (the “Representative in Switzerland”) FIRST INDEPENDENT FUND SERVICES LTD, Feldeggstrasse 12, CH-8008 Zurich. Swiss Paying Agent: Helvetische Bank AG, Seefeldstrasse 215, CH-8008 Zurich. In respect of the units of the Redwheel-managed funds offered in Switzerland, the place of performance is at the registered office of the Swiss Representative. The place of jurisdiction is at the registered office of the Swiss Representative or at the registered office or place of residence of the investor.

No investment strategy or risk management technique can guarantee returns or eliminate risks in any market environment.The term “RWC” may include any one or more RWC branded entities including RWC Partners Limited and RWC Asset Management LLP, each of which is authorised and regulated by the UK Financial Conduct Authority and, in the case of RWC Asset Management LLP, the US Securities and Exchange Commission; RWC Asset Advisors (US) LLC, which is registered with the US Securities and Exchange Commission; and RWC Singapore (Pte) Limited, which is licensed as a Licensed Fund Management Company by the Monetary Authority of Singapore.RWC may act as investment manager or adviser, or otherwise provide services, to more than one product pursuing a similar investment strategy or focus to the product detailed in this audio. RWC seeks to minimise any conflicts of interest, and endeavours to act at all times in accordance with its legal and regulatory obligations as well as its own policies and codes of conduct.This audio is directed only at professional, institutional, wholesale or qualified investors. The services provided by RWC are available only to such persons. It is not intended for distribution to and should not be relied on by any person who would qualify as a retail or individual investor in any jurisdiction or for distribution to, or use by, any person or entity in any jurisdiction where such distribution or use would be contrary to local law or regulation.This audio has been prepared for general information purposes only and has not been delivered for registration in any jurisdiction nor has its content been reviewed or approved by any regulatory authority in any jurisdiction. The information contained herein does not constitute: (i) a binding legal agreement; (ii) legal, regulatory, tax, accounting or other advice; (iii) an offer, recommendation or solicitation to buy or sell shares in any fund, security, commodity, financial instrument or derivative linked to, or otherwise included in a portfolio managed or advised by RWC; or(iv) an offer to enter into any other transaction whatsoever (each a “Transaction”). No representations and/or warranties are made that the information contained herein is either up to date and/or accurate and is not intended to be used or relied upon by any counterparty, investor or any other third party.RWC uses information from third party vendors, such as statistical and other data, that it believes to be reliable. However, the accuracy of this data, which may be used to calculate results or otherwise compile data that finds its way over time into RWC research data stored on its systems, is not guaranteed. If such information is not accurate, some of the conclusions reached or statements made may be adversely affected. RWC bears no responsibility for your investment research and/or investment decisions and you should consult your own lawyer, accountant, tax adviser or other professional adviser before entering into any Transaction. Any opinion expressed herein, which may be subjective in nature, may not be shared by all directors, officers, employees, or representatives of RWC and may be subject to change without notice. RWC is not liable for any decisions made or actions or in actions taken by you or others based on the contents of this audio and neither RWC nor any of its directors, officers, employees, or representatives (including affiliates) accepts any liability whatsoever for any errors and/or omissions or for any direct, indirect, special, incidental, or consequential loss, damages, or expenses of any kind howsoever arising from the use of, or reliance on, any information contained herein.Information contained in this audio should not be viewed as indicative of future results. Past performance of any Transaction is not indicative of future results. The value of investments can go down as well as up. Certain assumptions and forward looking statements may have been made either for modelling purposes, to simplify the audio and/or calculation of any projections or estimates contained herein and RWC does not represent that that any such assumptions or statements will reflect actual future events or that all assumptions have been considered or stated. Forward-looking statements are inherently uncertain, and changing factors such as those affecting the markets generally, or those affecting particular industries or issuers, may cause results to differ from those discussed. Accordingly, there can be no assurance that estimated returns or projections will be realised or that actual returns or performance results will not materially differ from those estimated herein. Some of the information contained in this audio may be aggregated data of Transactions executed by RWC that has been compiled so as not to identify the underlying Transactions of any particular customer.The information transmitted is intended only for the person or entity to which it has been given and may contain confidential and/or privileged material. In accepting receipt of the information transmitted you agree that you and/or your affiliates, partners, directors, officers and employees, as applicable, will keep all information strictly confidential. Any review, retransmission, dissemination or other use of, or taking of any action in reliance upon, this information is prohibited. The information contained herein is confidential and is intended for the exclusive use of the intended recipient(s) to which this audio has been provided. Any distribution or reproduction of this audio is not authorised and is prohibited without the express written consent of RWC or any of its affiliates.Changes in rates of exchange may cause the value of such investments to fluctuate. An investor may not be able to get back the amount invested and the loss on realisation may be very high and could result in a substantial or complete loss of the investment. In addition, an investor who realises their investment in a RWC-managed fund after a short period may not realise the amount originally invested as a result of charges made on the issue and/or redemption of such investment. The value of such interests for the purposes of purchases may differ from their value for the purpose of redemptions. No representations or warranties of any kind are intended or should be inferred with respect to the economic return from, or the tax consequences of, an investment in a RWC-managed fund. Current tax levels and reliefs may change. Depending on individual circumstances, this may affect investment returns. Nothing in this document constitutes advice on the merits of buying or selling a particular investment. This audio expresses no views as to the suitability or appropriateness of the fund or any other investments described herein to the individual circumstances of any recipient.AIFMD and Distribution in the European Economic Area (“EEA”)The Alternative Fund Managers Directive (Directive 2011/61/EU)(“AIFMD”) is a regulatory regime which came into full effect in the EEA on 22 July 2014. RWC Asset Management LLP is an Alternative Investment Fund Manager (an “AIFM”) to certain funds managed by it (each an “AIF”). The AIFM is required to make available to investors certain prescribed information prior to their investment in an AIF. The majority of the prescribed information is contained in the latest Offering Document of the AIF. The remainder of the prescribed information is contained in the relevant AIF’s annual report and accounts. All of the information is provided in accordance with the AIFMD.In relation to each member state of the EEA (each a “Member State”),this document may only be distributed and shares in a RWC fund(“Shares”) may only be offered and placed to the extent that (a) the relevant RWC fund is permitted to be marketed to professional investors in accordance with the AIFMD (as implemented into the local law/regulation of the relevant Member State); or (b) this audio may otherwise be lawfully distributed and the Shares may lawfully offered or placed in that Member State (including at the initiative of the investor).Information Required for Distribution of Foreign Collective Investment Schemes to Qualified Investors in SwitzerlandThe representative and paying agent of the RWC-managed funds in Switzerland (the “Representative in Switzerland”) FIRST INDEPENDENT FUND SERVICES LTD, Klausstrasse 33, CH-8008 Zurich. Swiss Paying Agent: Helvetische Bank AG, Seefeldstrasse 215, CH-8008 Zurich. In respect of the units of the RWC-managed funds distributed in Switzerland, the place of performance and jurisdiction is at the registered office of the Representative in Switzerland.