










Convertible bonds provide a hybrid solution for investors looking for a balanced exposure to financial markets that combines the attractive elements of both equities and bonds. They aim to deliver upside participation in rising markets while helping protect capital during downturns.
Emerging & Frontier Markets strategies focus on capturing high-growth opportunities across the world’s fastest-growing economies. With a long-standing, index-agnostic approach, the team invests both directly in these markets and in developed market companies with significant exposure to them.
By harnessing the power of dividends, our team aims to deliver a combination of income and long-term capital growth by investing in a diversified portfolio of global equities. The strategy is designed for investors seeking a disciplined approach, targeting a rare combination of premium yield, durable income, and attractive valuation, while selectively investing in overlooked opportunities where short-term controversies have created potential mispricing.
Redwheel’s Global Intrinsic Value team is led by Ian Lance and Nick Purves, who each have over 30 years’ investment experience and have worked together for nearly 20 years across multiple market cycles. Alongside a team of global analysts, they are dedicated value investors seeking to identify undervalued, durable companies with strong cash flows and robust balance sheets.
Structural shifts driven by regulation, technological innovation, and the global energy transition are creating long-term growth opportunities across infrastructure sectors. Our team invests in publicly traded companies across developed and emerging markets that provide essential services and assets supporting economic activity and societal development.
Our Natural Capital strategy seeks to deliver long-term capital growth by investing in global companies that contribute to the preservation and restoration of the planet’s natural resources. As ecosystems come under increasing pressure from pollution and resource depletion, while remaining fundamental to economic and societal stability, we see a compelling opportunity in nature-positive solutions.
Our Active Ownership strategies are built on the belief that companies with active, engaged shareholders are more likely to generate superior long-term returns. The core focus of the strategies is to invest in concentrated portfolios of European and Japanese companies that are receptive to engagement, targeting fundamentally sound businesses with significant upside potential over a three- to five-year time horizon.

At Redwheel, Stewardship is our overarching approach to responsible investing, bringing together Sustainability, Active Ownership and Greenwheel Research & Insights into a single, disciplined framework. Through this framework we integrate material sustainability considerations into investment decisions, support investment teams with central expertise, and use focused engagement, proxy voting and thematic research to protect and enhance long-term client outcomes.
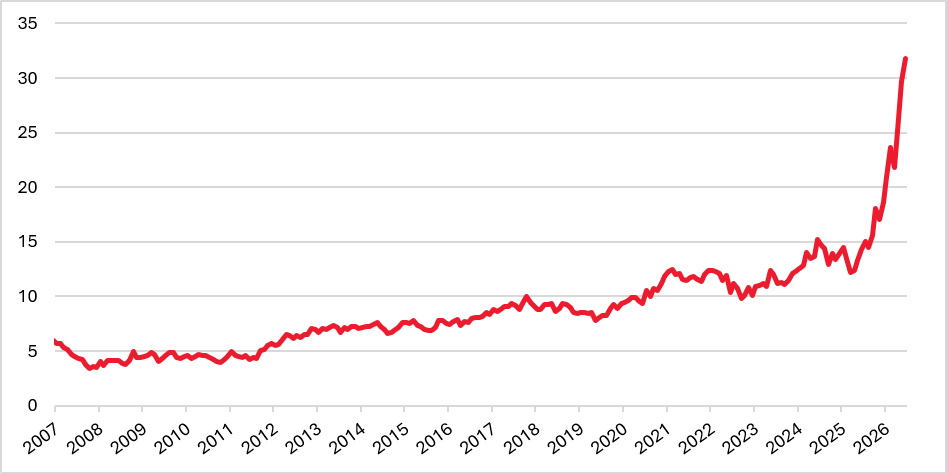
The growing market capitalization of the largest companies in equity indices has become a serious problem for investors trying to construct diversified equity portfolios. The MSCI Emerging Markets Index is one of the most extreme examples of issuer concentration, with the three biggest companies accounting for over 30% of the market capitalization of an index that contains nearly 1,200 securities.
We first noted the tendency towards mega-capitalization stocks in November 2024[1], when the ‘Fab 4’ (Taiwan Semiconductor, Tencent, Samsung Electronics & Alibaba) accounted for just under 20% of the index. The problem posed by the ‘FOMO 3’ is now even more acute: Taiwan Semiconductor is now 15% of the index, while Samsung Electronics and SK Hynix are just over 8% each.[2]
However, under‑represented countries, sectors and themes offer a rich seam of idiosyncratic growth and diversification opportunities for allocators willing to look beyond index heavyweights.
Chart 1: FOMO 3 as a % of the MSCI Emerging Markets Index
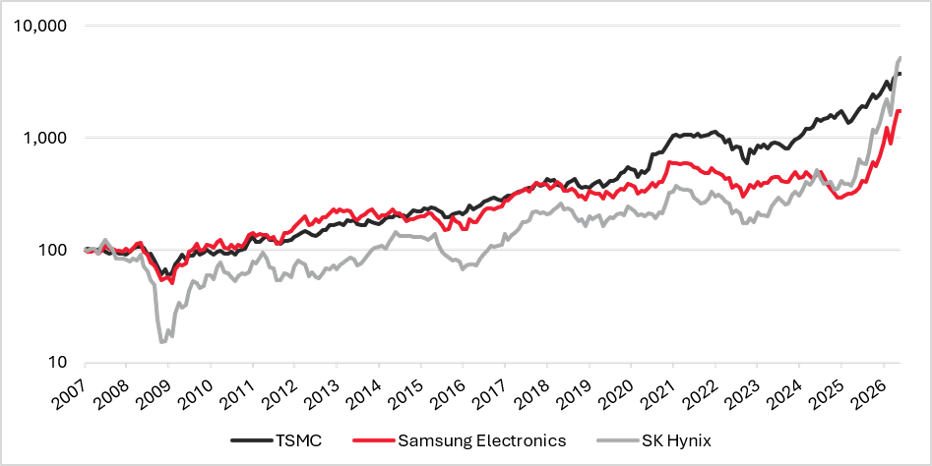
Taiwan Semiconductor and Samsung Electronics have been two of the biggest index constituents since the Global Financial Crisis in 2008, and they have significantly outperformed the MSCI Emerging Markets Index over a multi-year period.[3] The rise of passive investing over the past couple of decades has resulted in performance-chasing behaviour, with each stock in the index being purchased in accordance with its current index weight, reinforcing the dominance of the biggest companies when there are inflows. The three largest companies account for over 70% of total index returns year to date[4]; we estimate that fewer than 20% of MSCI Emerging Markets Index constituents have outperformed the index so far this year.
Chart 2: Performance of the FOMO 3 (log scale)
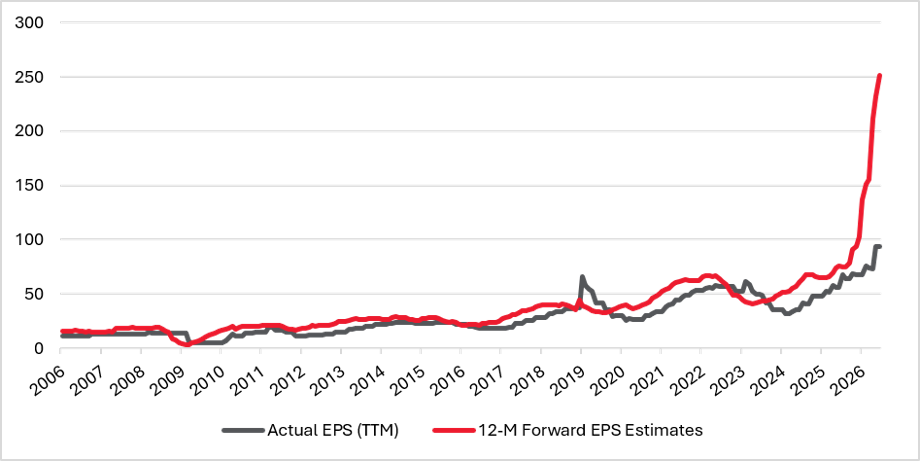
Technology has not always been as singularly important as it is today, but its weight began to increase after the COVID-19 pandemic in 2020 and, with the adoption of AI, now accounts for an unprecedented 45% of the MSCI Emerging Markets Index.[5] Essentially, the technology sector has risen in line with its forward earnings estimates. The recent steep climb in earnings raises questions about their long-term sustainability and increases the risk of equally sharp future corrections.
Chart 3: MSCI Emerging Markets Information Technology sector – Actual vs. 12-month forward EPS (USD)
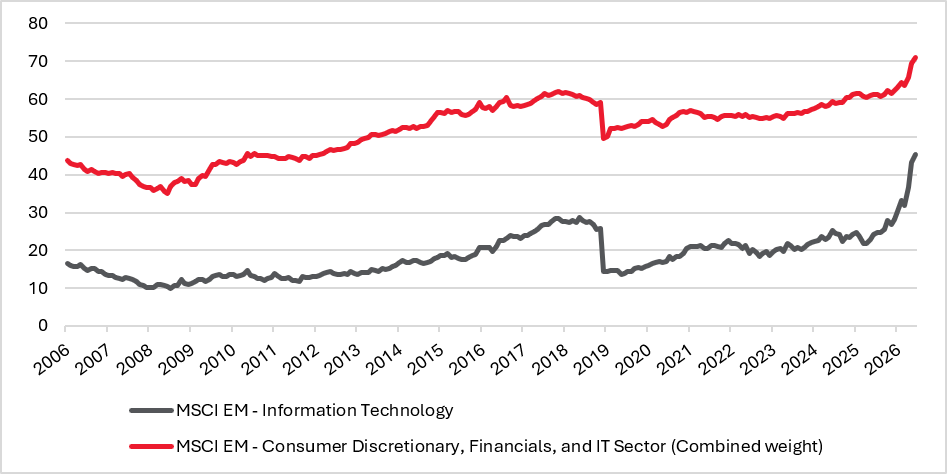
Financials and Consumer Discretionary are the other two significant sectors, but Technology would be even bigger were it not for the reclassification of internet stocks from Information Technology to Consumer Discretionary and Communication Services at the end of 2018. The largest of these companies: Alibaba, Baidu, Tencent and Netease still account for about 5% of the MSCI Emerging Markets Index. The Information Technology sector would have been 50% of the investable universe today had the reclassification not been implemented.[6]
Chart 4: MSCI EM: Top 3 and IT sector weight (%)
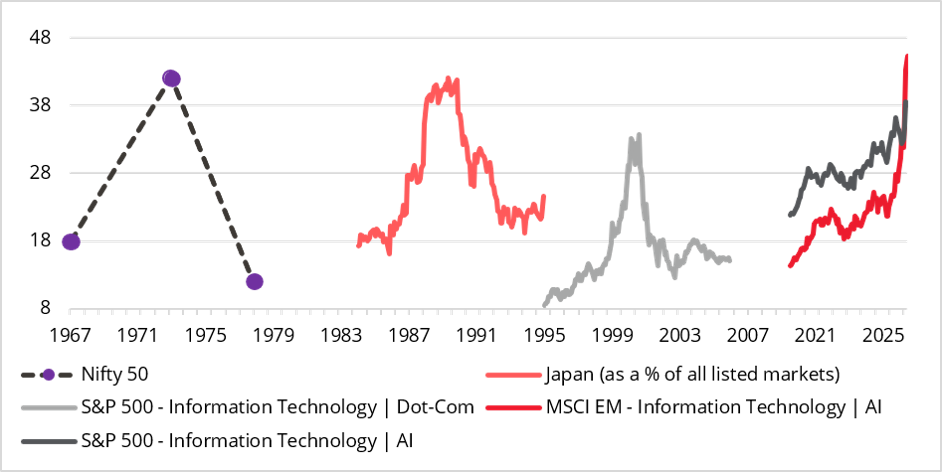
By way of comparison, single countries, sectors or themes have rarely exceeded 40% of total capitalization for more than a year or two at a time. Both Japan and the ‘Nifty 50’ peaked at 42% of global and US market capitalization, respectively, before reverting to around 20%; even the dot-com boom peaked in the mid-30% range. The current EM technology weight of 45% is unprecedented in the 20th and 21st centuries.
Chart 5: Periods of concentration as a % of market capitalization
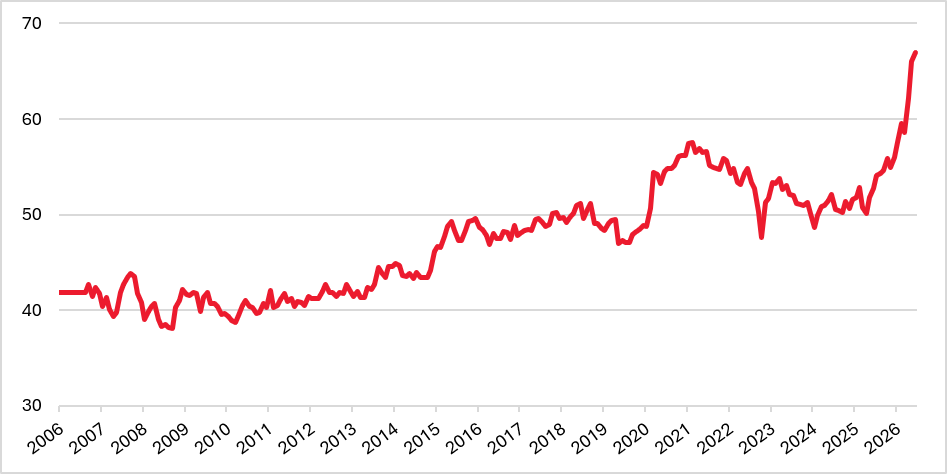
China, Korea and Taiwan have consistently been three of the largest and most important markets in the MSCI Emerging Markets universe.
Chart 6: Top three countries as a % of the MSCI Emerging Markets Index
Evidence of ever-increasing concentration is apparent at the country level, with the top three countries now comprising two thirds of the entire index; Korea and Taiwan – the home of many of the world’s most important technology companies – amount to over half the weight of MSCI’s index. With two dozen country constituents, other countries’ average weight is just over 2% each, and 15 countries weigh in below the 1% threshold.[7] It has become more difficult to achieve a diversified emerging markets portfolio given the index skew.
The purpose of investing in EM is to achieve diversification and take advantage of superior idiosyncratic growth opportunities at lower valuations than are usually available in developed markets. The dominance of three gigantic technology companies, whose market capitalization exceeds $1tn each in Korea and Taiwan,[8] means that index-following EM equity investors are more dependent on a single global AI theme than they are to individual country, sector and stock opportunities. The sheer size of the companies in question makes it almost impossible for any other than passive EM investors to achieve overweight positions without breaching concentration limits, even if they wish to. Taking advantage of potential growth opportunities that are unique to EM investors means deviating significantly from benchmark index weights.
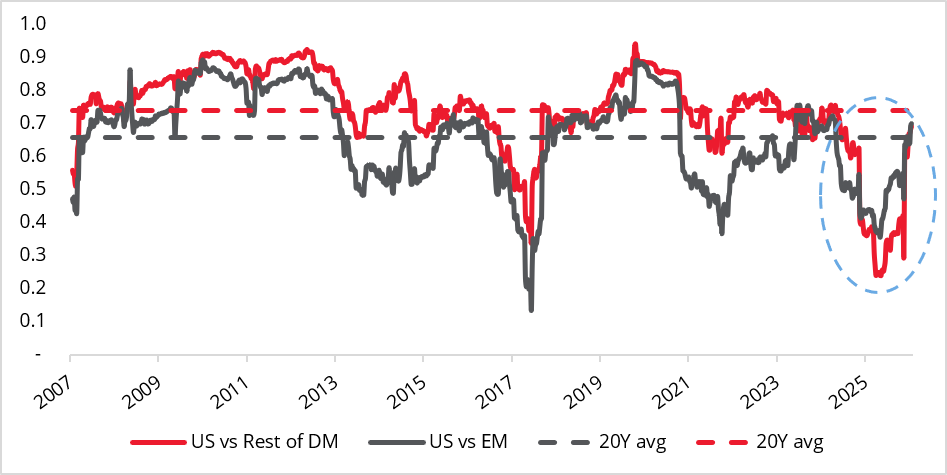
MSCI EM correlations with the US have usually been lower than MSCI DM correlations with the US, indicating the value of emerging markets in diversifying global equity portfolios.
However, the increase in the weight of the technology sector, which is dominated by AI-related companies, has resulted in higher correlation of EM equities to the US, depriving equity investors of the important element of diversification. As the technology sector began to dominate in 2025 and continued to rise in 2026, emerging market equities have started to mirror the performance of the US, which is also dominated by mega-capitalization technology companies. The monthly correlation of the MSCI Emerging Markets Index with the MSCI USA Index is now nearly 70% and higher even than developed markets to the US; this means that EM investors ought to look outside the technology sector for diversification and idiosyncratic emerging market growth opportunities.
Chart 7: Rolling 12-Month return correlation
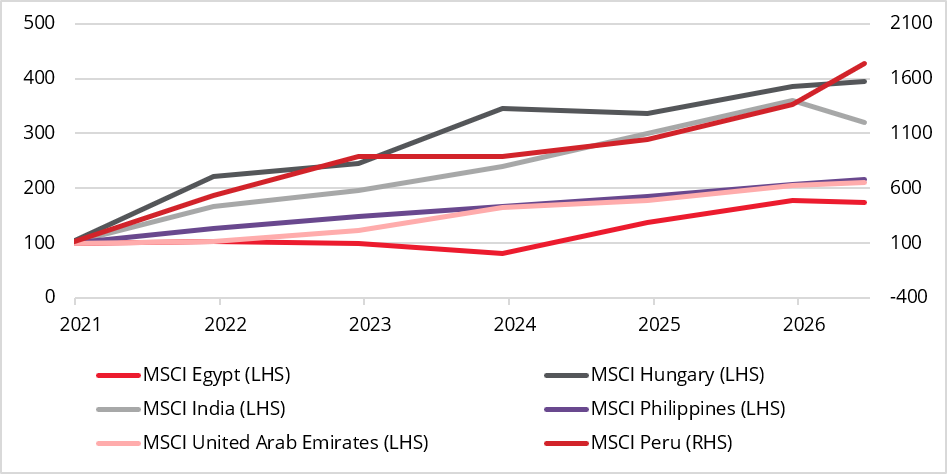
Investors allocate to emerging markets because of the general combination of growth and value. Outside Asian technology, much of the best growth potential is to be found in smaller countries. Many smaller emerging markets including Egypt, Hungary, India, Peru, Philippines and UAE have all exhibited impressive USD earnings growth since the COVID-19 pandemic in 2020. This is important considering the tendency for the USD to have strengthened against EM currencies over the long run.
Chart 8: Earnings growth (%) of smaller emerging markets
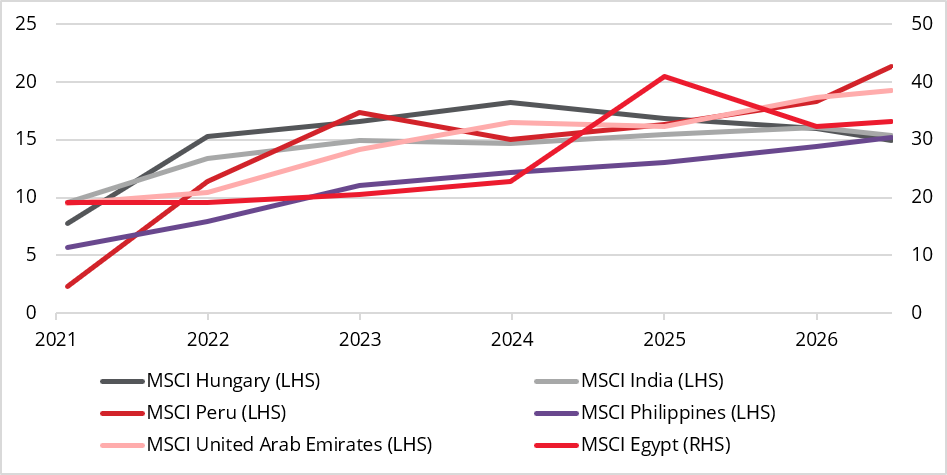
As USD earnings have improved, return on equity (ROE) has also increased, supporting a long-term re-rating of valuations.
Chart 9: Return on equity (%) of smaller emerging markets
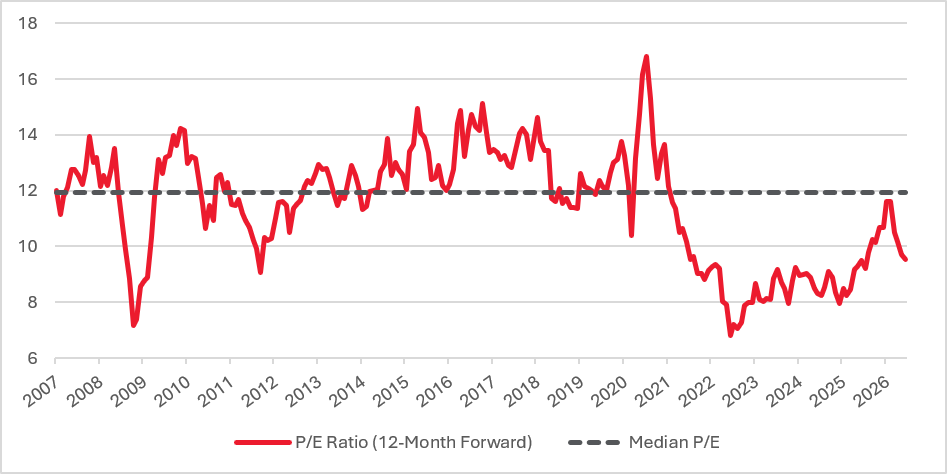
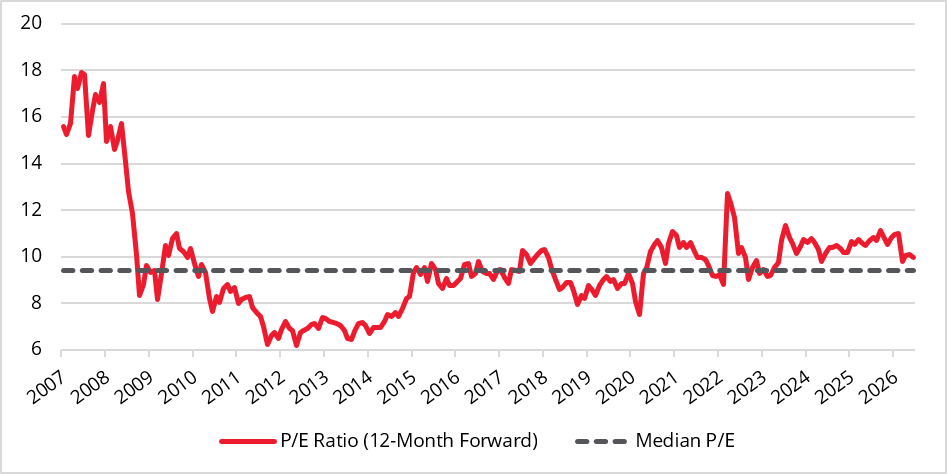
Many countries also exhibit good value characteristics; there are several markets on single-digit earnings multiples. In Latin America, both Brazil and Colombia are valued below 10 times forward earnings and await the catalyst of lower interest rates to re-rate upwards.
Chart 10: MSCI Emerging Markets Latin America Index – 12-month forward P/E
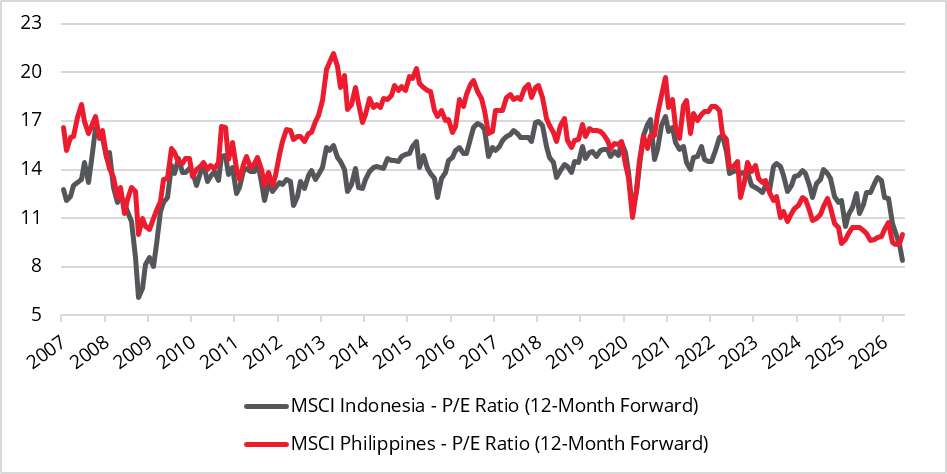
In Asia, Indonesia and Philippines have been similarly de-rated and, if US / Iran hostilities cease, should have the benefit of lower oil prices to aid economic growth.
Chart 11: MSCI Indonesia & Philippines – 12-month forward P/E
Almost every country constituent in EMEA is comparably valued, with Egypt, Greece, Hungary, Poland, Qatar, South Africa and Turkey all trading on less than 10 times forward earnings and well placed to re-rate if growth expectations are delivered.
Chart 12: MSCI Emerging Markets Europe, Middle East, and Africa Index – 12-month forward P/E
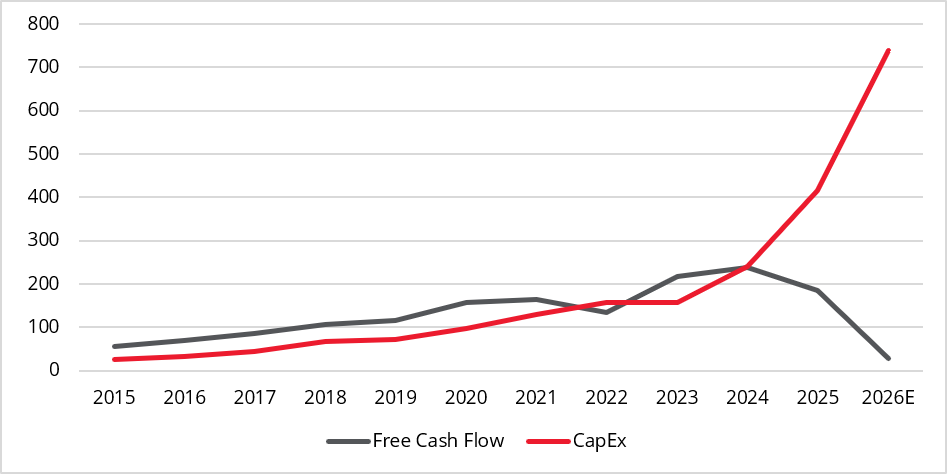
The AI buildout is transferring capital from hyperscalers to semiconductor and hardware companies at an unsustainable pace. Surging compute demand, rising memory intensity, and component shortages are pushing the free cash flow of the ‘Big-5’ US hyperscalers[9] significantly lower in year-end 2026 forecasts[10] as CapEx overwhelms cash generation. At the same time, many logic and memory semiconductor producers are reporting record sales, profitability, and cash generation.
This dynamic has set the backdrop for the rise of the FOMO 3; however, we ultimately believe that many of these technology products are commodities, and that cyclical dynamics will re-emerge, pushing prices lower and reducing the earnings and cash generation potential of many technology producers.[11]
Chart 13: Big-5 US hyperscaler free cash flow and capex ($bn)
As emerging markets have become dominated by three mega-capitalization companies, the Technology sector now comprises an unprecedented 45% of the overall index; relative performance therefore depends upon exposure to these constituents. The risks are that active EM portfolios all own the same securities to keep pace with the index, and that returns could reverse if capital expenditure on AI-related projects slows. EM correlations with the US market have risen, implying that the asset class offers less diversification and fewer idiosyncratic opportunities because of the dominance of technology.
Yet investors can still find superior growth at discounted valuations by looking for investment ideas in many smaller emerging markets, and by investing in other themes besides AI that stand to benefit from a resurgence in capital expenditures; examples include defence, the energy transition and energy security.
Sources:
[1] See ‘The big get bigger – concentrating on the ‘Fab Four’, Redwheel, November 2024.
[2] Portfolio holdings are subject to change at any time without notice. This information should not be construed as a recommendation to purchase or sell any security
[3] Bloomberg, June 2026
[4] Bloomberg, June 2026
[5] Bloomberg, June 2026
[6] Bloomberg, Redwheel, June 2026
[7] Bloomberg, 30 June 2026
[8] Bloomberg, 30 June 2026
[9] Big-5 US hyperscalers are Amazon, Google, Meta, Microsoft and Oracle.
[10] Bloomberg, June 2026
[11] No investment strategy or risk management technique can guarantee returns or eliminate risks in any market environment.
Key Information
No investment strategy or risk management technique can guarantee returns or eliminate risks in any market environment. Past performance is not a guide to the future. The prices of investments and income from them may fall as well as rise and investors may not get back the full amount invested. Forecasts and estimates are based upon subjective assumptions about circumstances and events that may not yet have taken place and may never do so. The statements and opinions expressed in this article are those of the author as of the date of publication, and do not necessarily represent the view of Redwheel. This article does not constitute investment advice and the information shown is for illustrative purposes only.
Redwheel’s Shaul Rosten looks at past market cycles to challenge the assumption that US equity dominance is here to stay. Read why he believes today’s valuations and market concentration could set the stage for a shift in leadership—and why his team’s value-investing lens points towards cheaper international markets.

Ecofin Portfolio Manager Michel Sznajer examines his strategy’s performance after previous peaks in bond yields and identifies potential takeover targets amid falling valuations and improving earnings prospects. Read his latest insight on the investment case for the sector—and the risks that could keep it under pressure.
Balanced convertibles are once again delivering meaningful equity participation while outpacing investment grade credit. Davide Basile, Portfolio Manager, Redwheel Convertible Bonds, argues that convertibles have reached a turning point, read more in his latest insight.
Redwheel ® and Ecofin ® are registered trademarks of RWC Partners Limited (“RWC”). The term “Redwheel” may include any one or more Redwheel branded regulated entities including RWC Asset Management LLP, which is authorised and regulated by the UK Financial Conduct Authority and the US Securities and Exchange Commission (“SEC”); RWC Asset Advisors (US) LLC, which is registered with the SEC; RWC Singapore (Pte) Limited, which is licensed as a Licensed Fund Management Company by the Monetary Authority of Singapore; Redwheel Australia Pty Ltd is an Australian Financial Services Licensee with the Australian Securities and Investment Commission; and Redwheel Europe Fondsmæglerselskab A/S which is regulated by the Danish Financial Supervisory Authority.
Redwheel may act as investment manager or adviser, or otherwise provide services, to more than one product pursuing a similar investment strategy or focus to the product detailed in this document. Redwheel and RWC (together “Redwheel Group”) seeks to minimise any conflicts of interest, and endeavours to act at all times in accordance with its legal and regulatory obligations as well as its own policies and codes of conduct.
This document is directed only at professional, institutional, wholesale or qualified investors. The services provided by Redwheel are available only to such persons. It is not intended for distribution to and should not be relied on by any person who would qualify as a retail or individual investor in any jurisdiction or for distribution to, or use by, any person or entity in any jurisdiction where such distribution or use would be contrary to local law or regulation.
This document has been prepared for general information purposes only and has not been delivered for registration in any jurisdiction nor has its content been reviewed or approved by any regulatory authority in any jurisdiction.
The information contained herein does not constitute: (i) a binding legal agreement; (ii) legal, regulatory, tax, accounting or other advice; (iii) an offer, recommendation or solicitation to buy or sell shares in any fund, security, commodity, financial instrument or derivative linked to, or otherwise included in a portfolio managed or advised by Redwheel; or (iv) an offer to enter into any other transaction whatsoever (each a “Transaction”). Redwheel Group bears no responsibility for your investment research and/or investment decisions and you should consult your own lawyer, accountant, tax adviser or other professional adviser before entering into any Transaction. No representations and/or warranties are made that the information contained herein is either up to date and/or accurate and is not intended to be used or relied upon by any counterparty, investor or any other third party.
Redwheel Group uses information from third party vendors, such as statistical and other data, that it believes to be reliable. However, the accuracy of this data, which may be used to calculate results or otherwise compile data that finds its way over time into Redwheel Group research data stored on its systems, is not guaranteed. If such information is not accurate, some of the conclusions reached or statements made may be adversely affected. Any opinion expressed herein, which may be subjective in nature, may not be shared by all directors, officers, employees, or representatives of Group and may be subject to change without notice. Redwheel Group is not liable for any decisions made or actions or inactions taken by you or others based on the contents of this document and neither Redwheel Group nor any of its directors, officers, employees, or representatives (including affiliates) accepts any liability whatsoever for any errors and/or omissions or for any direct, indirect, special, incidental, or consequential loss, damages, or expenses of any kind howsoever arising from the use of, or reliance on, any information contained herein.
Information contained in this document should not be viewed as indicative of future results. Past performance of any Transaction is not indicative of future results. The value of investments can go down as well as up. Certain assumptions and forward looking statements may have been made either for modelling purposes, to simplify the presentation and/or calculation of any projections or estimates contained herein and Redwheel Group does not represent that that any such assumptions or statements will reflect actual future events or that all assumptions have been considered or stated. There can be no assurance that estimated returns or projections will be realised or that actual returns or performance results will not materially differ from those estimated herein. Some of the information contained in this document may be aggregated data of Transactions executed by Redwheel that has been compiled so as not to identify the underlying Transactions of any particular customer.
No representations or warranties of any kind are intended or should be inferred with respect to the economic return from, or the tax consequences of, an investment in a Redwheel-managed fund.
This document expresses no views as to the suitability or appropriateness of the fund or any other investments described herein to the individual circumstances of any recipient.
The information transmitted is intended only for the person or entity to which it has been given and may contain confidential and/or privileged material. In accepting receipt of the information transmitted you agree that you and/or your affiliates, partners, directors, officers and employees, as applicable, will keep all information strictly confidential. Any review, retransmission, dissemination or other use of, or taking of any action in reliance upon, this information is prohibited. Any distribution or reproduction of this document is not authorised and is prohibited without the express written consent of Redwheel Group.
Funds managed by Redwheel are not, and will not be, registered under the Securities Act of 1933 (the “Securities Act”) and are not available for purchase by US persons (as defined in Regulation S under the Securities Act) except to persons who are “qualified purchasers” (as defined in the Investment Company Act of 1940) and “accredited investors” (as defined in Rule 501(a) under the Securities Act).
This document does not constitute an offer to sell, purchase, subscribe for or otherwise invest in units or shares of any fund managed by Redwheel. Any offering is made only pursuant to the relevant offering document and the relevant subscription application. Prospective investors should review the offering memorandum in its entirety, including the risk factors in the offering memorandum, before making a decision to invest.
AIFMD and Distribution in the European Economic Area (“EEA”)
The Alternative Fund Managers Directive (Directive 2011/61/EU) (“AIFMD”) is a regulatory regime which came into full effect in the EEA on 22 July 2014. RWC Asset Management LLP is an Alternative Investment Fund Manager (an “AIFM”) to certain funds managed by it (each an “AIF”). The AIFM is required to make available to investors certain prescribed information prior to their investment in an AIF. The majority of the prescribed information is contained in the latest Offering Document of the AIF. The remainder of the prescribed information is contained in the relevant AIF’s annual report and accounts. All of the information is provided in accordance with the AIFMD.
In relation to each member state of the EEA (each a “Member State”), this document may only be distributed and shares in a Redwheel fund (“Shares”) may only be offered and placed to the extent that (a) the relevant Redwheel fund is permitted to be marketed to professional investors in accordance with the AIFMD (as implemented into the local law/regulation of the relevant Member State); or (b) this document may otherwise be lawfully distributed and the Shares may lawfully be offered or placed in that Member State (including at the initiative of the investor).
Information Required for Offering in Switzerland of Foreign Collective Investment Schemes to Qualified Investors within the meaning of Article 10 CISA.
This is an advertising document.
The representative and paying agent of the Redwheel-managed funds in Switzerland (the “Representative in Switzerland”) FIRST INDEPENDENT FUND SERVICES LTD, Feldeggstrasse 12, CH-8008 Zurich. Swiss Paying Agent: Helvetische Bank AG, Seefeldstrasse 215, CH-8008 Zurich. In respect of the units of the Redwheel-managed funds offered in Switzerland, the place of performance is at the registered office of the Swiss Representative. The place of jurisdiction is at the registered office of the Swiss Representative or at the registered office or place of residence of the investor.
No investment strategy or risk management technique can guarantee returns or eliminate risks in any market environment.The term “RWC” may include any one or more RWC branded entities including RWC Partners Limited and RWC Asset Management LLP, each of which is authorised and regulated by the UK Financial Conduct Authority and, in the case of RWC Asset Management LLP, the US Securities and Exchange Commission; RWC Asset Advisors (US) LLC, which is registered with the US Securities and Exchange Commission; and RWC Singapore (Pte) Limited, which is licensed as a Licensed Fund Management Company by the Monetary Authority of Singapore.RWC may act as investment manager or adviser, or otherwise provide services, to more than one product pursuing a similar investment strategy or focus to the product detailed in this audio. RWC seeks to minimise any conflicts of interest, and endeavours to act at all times in accordance with its legal and regulatory obligations as well as its own policies and codes of conduct.This audio is directed only at professional, institutional, wholesale or qualified investors. The services provided by RWC are available only to such persons. It is not intended for distribution to and should not be relied on by any person who would qualify as a retail or individual investor in any jurisdiction or for distribution to, or use by, any person or entity in any jurisdiction where such distribution or use would be contrary to local law or regulation.This audio has been prepared for general information purposes only and has not been delivered for registration in any jurisdiction nor has its content been reviewed or approved by any regulatory authority in any jurisdiction. The information contained herein does not constitute: (i) a binding legal agreement; (ii) legal, regulatory, tax, accounting or other advice; (iii) an offer, recommendation or solicitation to buy or sell shares in any fund, security, commodity, financial instrument or derivative linked to, or otherwise included in a portfolio managed or advised by RWC; or(iv) an offer to enter into any other transaction whatsoever (each a “Transaction”). No representations and/or warranties are made that the information contained herein is either up to date and/or accurate and is not intended to be used or relied upon by any counterparty, investor or any other third party.RWC uses information from third party vendors, such as statistical and other data, that it believes to be reliable. However, the accuracy of this data, which may be used to calculate results or otherwise compile data that finds its way over time into RWC research data stored on its systems, is not guaranteed. If such information is not accurate, some of the conclusions reached or statements made may be adversely affected. RWC bears no responsibility for your investment research and/or investment decisions and you should consult your own lawyer, accountant, tax adviser or other professional adviser before entering into any Transaction. Any opinion expressed herein, which may be subjective in nature, may not be shared by all directors, officers, employees, or representatives of RWC and may be subject to change without notice. RWC is not liable for any decisions made or actions or in actions taken by you or others based on the contents of this audio and neither RWC nor any of its directors, officers, employees, or representatives (including affiliates) accepts any liability whatsoever for any errors and/or omissions or for any direct, indirect, special, incidental, or consequential loss, damages, or expenses of any kind howsoever arising from the use of, or reliance on, any information contained herein.Information contained in this audio should not be viewed as indicative of future results. Past performance of any Transaction is not indicative of future results. The value of investments can go down as well as up. Certain assumptions and forward looking statements may have been made either for modelling purposes, to simplify the audio and/or calculation of any projections or estimates contained herein and RWC does not represent that that any such assumptions or statements will reflect actual future events or that all assumptions have been considered or stated. Forward-looking statements are inherently uncertain, and changing factors such as those affecting the markets generally, or those affecting particular industries or issuers, may cause results to differ from those discussed. Accordingly, there can be no assurance that estimated returns or projections will be realised or that actual returns or performance results will not materially differ from those estimated herein. Some of the information contained in this audio may be aggregated data of Transactions executed by RWC that has been compiled so as not to identify the underlying Transactions of any particular customer.The information transmitted is intended only for the person or entity to which it has been given and may contain confidential and/or privileged material. In accepting receipt of the information transmitted you agree that you and/or your affiliates, partners, directors, officers and employees, as applicable, will keep all information strictly confidential. Any review, retransmission, dissemination or other use of, or taking of any action in reliance upon, this information is prohibited. The information contained herein is confidential and is intended for the exclusive use of the intended recipient(s) to which this audio has been provided. Any distribution or reproduction of this audio is not authorised and is prohibited without the express written consent of RWC or any of its affiliates.Changes in rates of exchange may cause the value of such investments to fluctuate. An investor may not be able to get back the amount invested and the loss on realisation may be very high and could result in a substantial or complete loss of the investment. In addition, an investor who realises their investment in a RWC-managed fund after a short period may not realise the amount originally invested as a result of charges made on the issue and/or redemption of such investment. The value of such interests for the purposes of purchases may differ from their value for the purpose of redemptions. No representations or warranties of any kind are intended or should be inferred with respect to the economic return from, or the tax consequences of, an investment in a RWC-managed fund. Current tax levels and reliefs may change. Depending on individual circumstances, this may affect investment returns. Nothing in this document constitutes advice on the merits of buying or selling a particular investment. This audio expresses no views as to the suitability or appropriateness of the fund or any other investments described herein to the individual circumstances of any recipient.AIFMD and Distribution in the European Economic Area (“EEA”)The Alternative Fund Managers Directive (Directive 2011/61/EU)(“AIFMD”) is a regulatory regime which came into full effect in the EEA on 22 July 2014. RWC Asset Management LLP is an Alternative Investment Fund Manager (an “AIFM”) to certain funds managed by it (each an “AIF”). The AIFM is required to make available to investors certain prescribed information prior to their investment in an AIF. The majority of the prescribed information is contained in the latest Offering Document of the AIF. The remainder of the prescribed information is contained in the relevant AIF’s annual report and accounts. All of the information is provided in accordance with the AIFMD.In relation to each member state of the EEA (each a “Member State”),this document may only be distributed and shares in a RWC fund(“Shares”) may only be offered and placed to the extent that (a) the relevant RWC fund is permitted to be marketed to professional investors in accordance with the AIFMD (as implemented into the local law/regulation of the relevant Member State); or (b) this audio may otherwise be lawfully distributed and the Shares may lawfully offered or placed in that Member State (including at the initiative of the investor).Information Required for Distribution of Foreign Collective Investment Schemes to Qualified Investors in SwitzerlandThe representative and paying agent of the RWC-managed funds in Switzerland (the “Representative in Switzerland”) FIRST INDEPENDENT FUND SERVICES LTD, Klausstrasse 33, CH-8008 Zurich. Swiss Paying Agent: Helvetische Bank AG, Seefeldstrasse 215, CH-8008 Zurich. In respect of the units of the RWC-managed funds distributed in Switzerland, the place of performance and jurisdiction is at the registered office of the Representative in Switzerland.